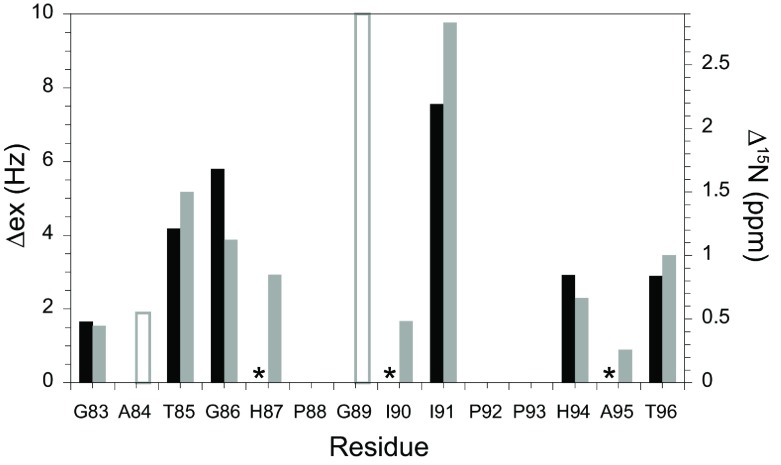
Figure 4. Correlation between the 15N conformational exchange linebroadening (Δex) in the 80′s loop of FKBP12 (black) and the differential chemical-shift predictions derived from two crystal forms of FKBP52 (grey).
Model-free [41] analysis of the R1, R2 and NOE 15N relaxation measurements was used to estimate conformational exchange linebroadening [22]. The differences in 15N chemical shift were predicted with SPARTA+ [49] applied to FKBP12 (PDB code 2PPN [31]) and the first FKBP domain of FKBP52 (PDB code 1Q1C [48] and non-equivalent monomers of PDB code 4LAW [45]). An asterisk indicates not statistical significant conformational exchange linebroadening (<~0.4 Hz). The amide resonances for both Ala84 and Gly89 are severely broadened due to rapid hydrogen exchange [22], precluding a reliable determination of conformational exchange linebroadening, and the predicted chemical shift differences for these two residues are indicated as open bars.

