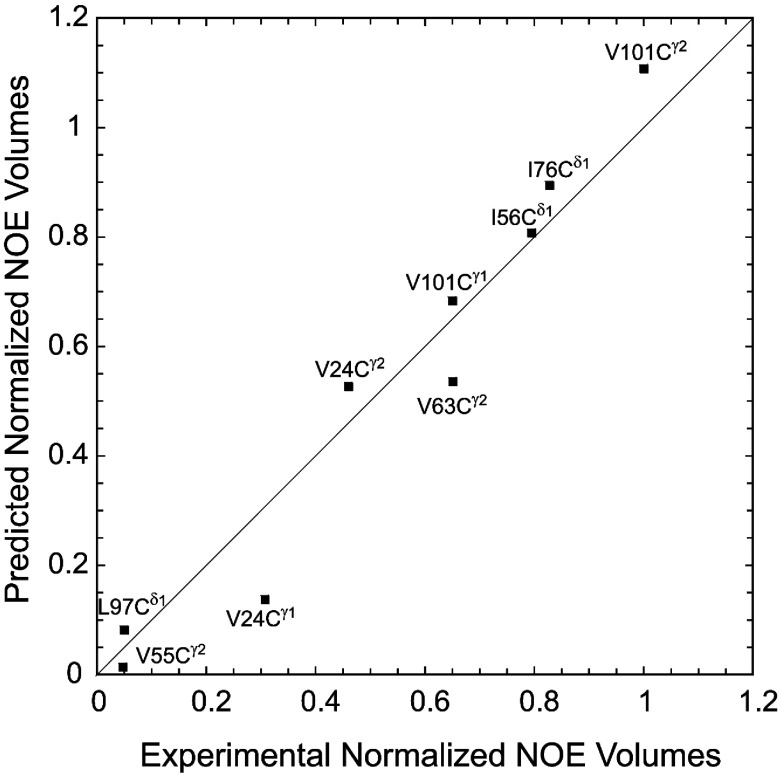
Figure 8. Predicted against observed NOE volumes for the methyl cross-peaks to Trp59 HNε1.
The experimental NOE volumes were normalized to the maximum value (Val101 Cγ2) and to the volumes of the corresponding 1H–13C cross-peaks in the 2D HSQC spectrum to compensate for relaxation and differential enrichment effects. Generalized order parameter calculations were performed on the crystal structures of the wild-type protein and G89P variants and then weighted at 80% and 20% respectively.

