
Figure 1.
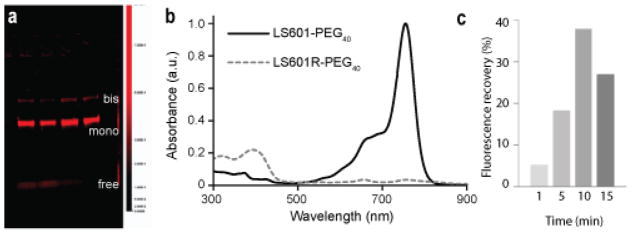
(a) SDS-PAGE gel for fractions collected from purification of the reaction mixture using a Sephadex G25 column (λex=785 nm, λem=810 nm). Based on the location on the gel the bands indicate the makeup of the product to be free LS601 7.5±2.7% (bottom band), mono LS601-PEG40 70.0±1.7% (middle band) and bis LS601-PEG40; 22.5±1.7% (top band); (b) UV/Vis spectra of LS601-PEG40 before and after reduction in PBS buffer. (c) Representative graphical comparison of % increase in fluorescence intensity over time following addition of Fenton’s Reagent to LS601R. This decrease in fluorescence after 10 min was attributed to subsequent oxidation of the fluorophore at high oxidative stress.