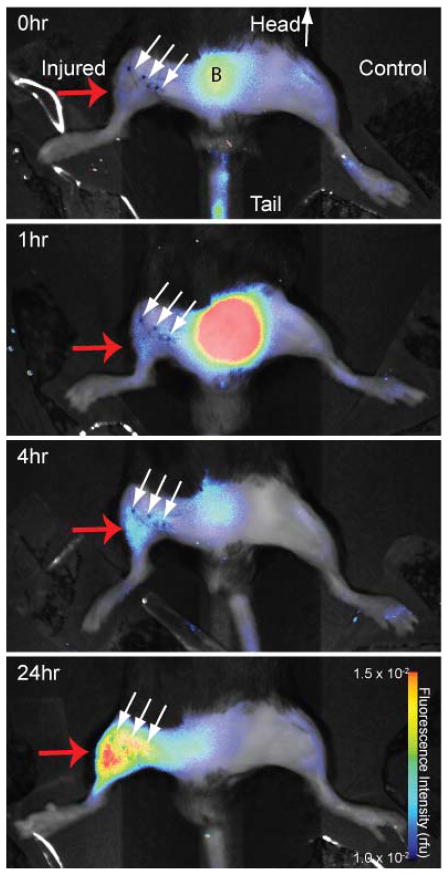
Figure 3.
Fluorescence intensity imaging of a mouse at 0, 1, 4, and 24 hr after injection of LS601R-PEG40 (λex=785 nm, λem=810 nm). Small arrows show the line of surgical incision, region B corresponds to bladder. Fluorescence increased an average of 5.8 times the post-injection values in the distal thigh of the injured limbs (red arrow) resulting from ROS detection at the site of ischemia. Fluorescence in the uninjured limbs was not significantly different (P>0.05) at different timepoints.

