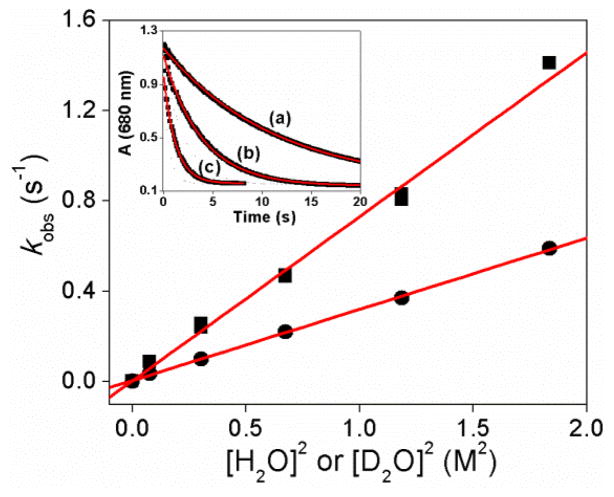
Fig. 2.
Plots of the substrate concentration square dependence of the pseudo-first-order rate constants for the oxidation of (■) H2O and (●) D2O by 1 in CD3CN at 10 °C. The red lines represent the best linear fits. Inset: time course of the decay of 0.3 mM 1 (black squares) monitored at 680 nm with the added H2O concentration of (a) 0.28 M, (b) 0.56 M and (c) 1.10 M in CD3CN at 10 °C. The red traces represent the fits according to the pseudo-first-order mode.

