
Figure 4.
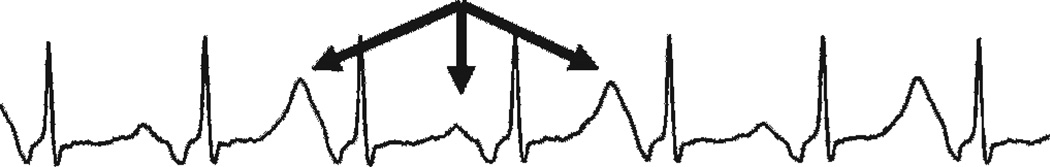
An ECG rhythm strip demonstrating significant macroscopic T-wave alternans. Note the alternating T-wave morphology and vector.
Official websites use .gov
A
.gov website belongs to an official
government organization in the United States.
Secure .gov websites use HTTPS
A lock (
) or https:// means you've safely
connected to the .gov website. Share sensitive
information only on official, secure websites.
An ECG rhythm strip demonstrating significant macroscopic T-wave alternans. Note the alternating T-wave morphology and vector.