
Figure 1.
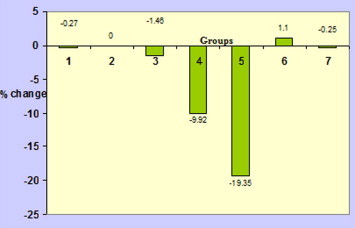
Percent change (as compared to vehicle control) in serum protein of different treatment groups of mice (group 1 = Untreated control; group 2 = Vehicle control; group 3 = Black tea control; group 4 = Vehicle + LD aflatoxin; group 5 = Vehicle + HD aflatoxin; group 6 = LD aflatoxin + black tea; group 7 = HD aflatoxin + black tea).