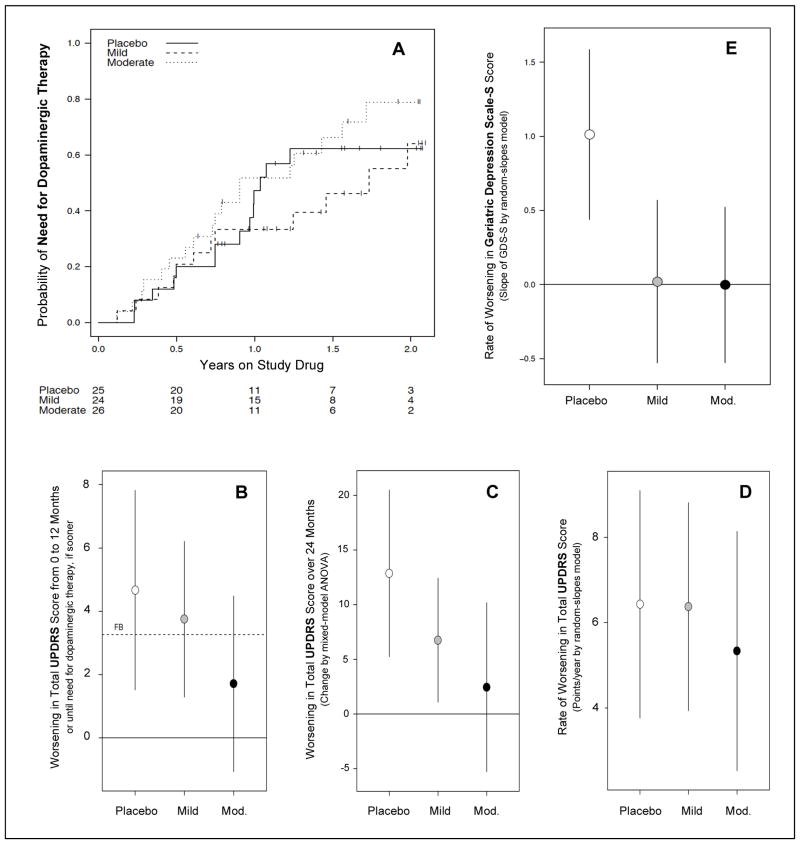
Figure 3. Secondary analyses of clinical outcomes in SURE-PD.
A, Kaplan-Meier curves showing time to disability warranting dopaminergic therapy for up to two years of follow-up for each of the three treatment groups. B, Futility analysis of the change in total UPDRS scores over 12 months or until need for dopaminergic therapy, based on NET-PD methodology.25,26 Much or most of the 95% confidence interval for the Mild or Moderate inosine treatment groups, respectively, falls below the futility boundary (FB) defined as 70% of the placebo group’s mean rate of change. C, 24-month change of total UDPRS score estimated from a mixed model ANOVA allowing unstructured profiles over time suggests a trend of decreasing rate with increasing inosine dose. D, A weaker trend is observed when employing a complementary random-slopes model incorporating gender-specific effects and assuming linearity in change over time. E, Rates of mood change during the study as assessed by differences in GDS-S scores over an average of 18 months follow-up. On either dose of inosine the rate appears slower (comparison-wise p < 0.001) compared to placebo.

