
FIGURE 2.
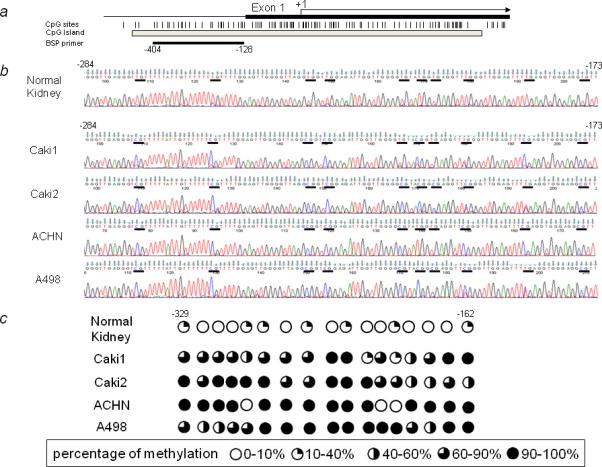
Methylation of the human sFRP-5 gene promoter. (a) Schematic representation of the promoter region of the human sFRP-5 gene and primer location. The vertical lines represent the location of CpG dinucleotides, and the gray box shows the CpG island. The black box indicates the first exon, and the arrow indicates the approximate position of the translation start site. The black horizontal line under the gray box indicates the region examined by bisulfite DNA sequencing. (b) Representative results of bisulfite sequencing for normal kidney and four RCC cell lines (from −284 to −173). The horizontal bars indicate CpG sites. (c) Methylation mapping of 17 CpG sites of the sFRP-5 promoter region obtained from bisulfite sequencing in normal kidney and RCC cell lines (from −329 to −162). Percentage of methylation was classified as indicated.