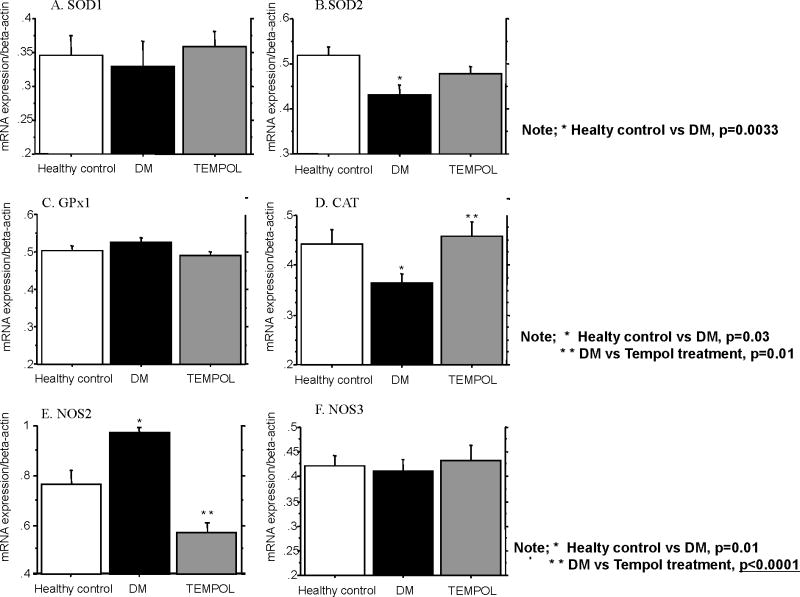
Figure 3.
Mean quantitative gene expression of SOD1 (A), SOD2 (B), GPx1 (C), CAT (D), NOS2 (E) and NOS3 (F) was analyzed using densitometry. In SOD1 mRNA expression there was no significant change among healthy controls, DM controls and the Tempol treatment group. However SOD2 mRNA expression in DM was significantly lower than healthy control’s and Tempol treatment partially restored its expression but did not reach significance. Glutathione peroxidase (GPX1) mRNA expression (C) was similar in all groups. CAT mRNA expression (D) in DM was significantly lower than in healthy controls and Tempol treatment restored CAT to healthy control level. NOS2 mRNA expression (E) in DM was significantly higher than healthy controls and Tempol treatment mRNA was lower than healthy controls. In NOS3 mRNA expression (F) there was no significant change among diabetes, healthy control and Tempol treatment group.

