
FIGURE 1.
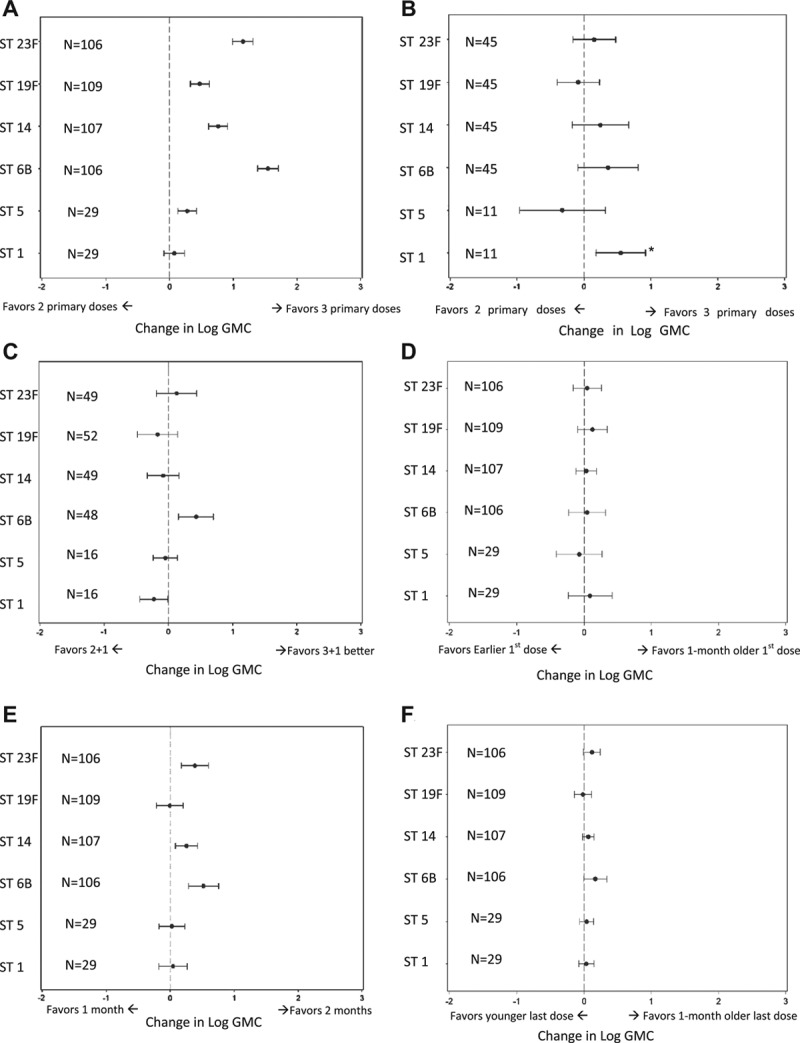
Effect of primary PCV dosing schedule on GMC by serotype. A) 2-dose versus 3-dose primary schedule on postprimary (~7 months) GMC; B) 2-dose versus 3-dose primary schedule on preboost (~12 months) GMC; C) effect of 2-dose versus 3-dose primary schedule on postboost (~13 months) GMC; D) effect of delaying age at first dose by 1 month on postprimary (~7 months) GMC; E) effect of increasing the interval between doses from 1 to 2 months on postprimary (~7 months) GMC and F) effect of delaying age at last dose by 1 month on postprimary (~7 months) GMC. Adjusted for age at first dose, geographic region, PCV product, coadministration of DTaP versus DTwP and laboratory method (GSK vs. Wyeth/other). N is the number of study arms. Asterick indicates that the significant ST1 finding in Figure 1B is due to 1 study where the two 2-dose arms had lower GMCs than the two 3-dose arms.33 Otherwise, when looking at other studies, there is no difference.