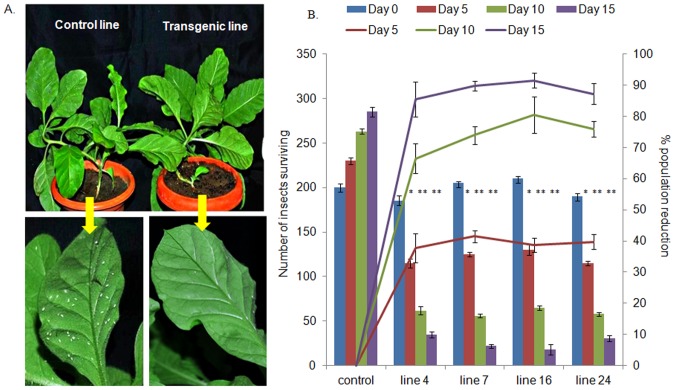
Figure 3. In-vivo bioassay of transgenic and control plants with whitefly.
Control and transgenic lines challenged with freshly emerged adult whiteflies. (A) Whiteflies colonizing on control plant while the transgenic lines show protection, lower panel shows enlarged view of upper panel (B) The surviving number of insects were counted after 5, 10 and 15 days. The count of whitefly and percent population reduction was plotted for each of the selected lines. Bars = number of insects; lines = population reduction over control. Data shown are average of six plants of each line (3experimental setups ×2 plants/setup) ± standard deviation. Asterisk indicates significant difference in treatments (transgenic plants) compared to control (dsasal) plants (Student's t-test, *p<0.05,**p<0.01).

