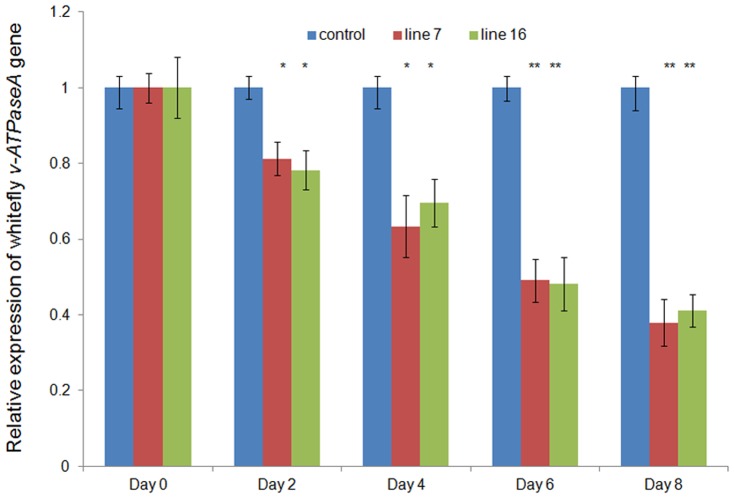
Figure 6. Silencing of whitefly v-ATPaseA after feeding on transgenic tobacco by qRT-PCR.
Graph shows significant down-regulation of v-ATPaseA gene of whiteflies after feeding on transgenic lines. Data shown are means ± standard deviations of each line. Asterisk indicates significant difference in treatments compared to control (Student's t-test, *p<0.05, **p<0.01,).

