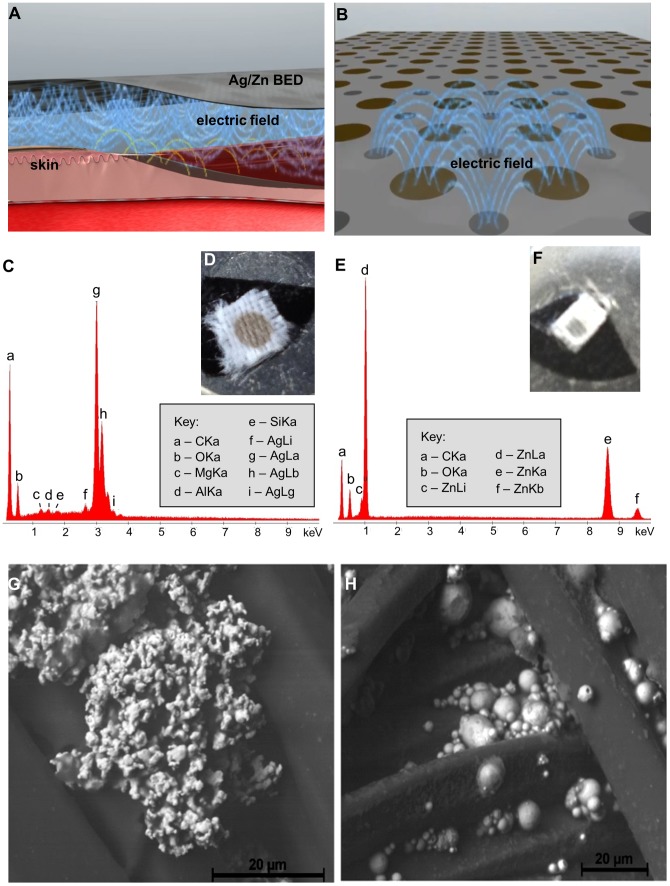
Figure 1. Characterization of the Ag/Zn BED.
(A, B) Schematic diagram of the design, application and electric fields generated by the bioelectric dressing, (C) EDS spectrum of a silver dot on a BED (D) EDS spectrum of a zinc dot on a BED. (E) Photographs of silver and (F) zinc dots of the BED mounted using carbon tape in an aluminum holder for energy dispersive spectroscopic (EDS) X-ray analysis. (G) Scanning electron microscope image of a silver dot on a BED (H) Scanning electron microscope image of a zinc dot on a BED.

