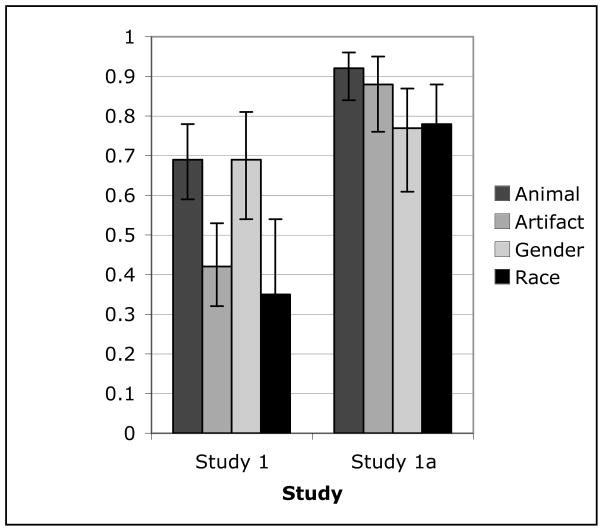
Figure 2.
Probabilities with 95% Confidence Intervals of Selecting the Hidden Picture (Study 1) or the Expected Category Match (Study 1a), by Domain
Note. The columns presenting data for animals and artifacts include all of the children (collapsed across whether they completed social category items for gender or race), as these items were identical across the two social category conditions. The columns presenting data for gender and race present children divided by whether they were assigned to the gender or race condition.

