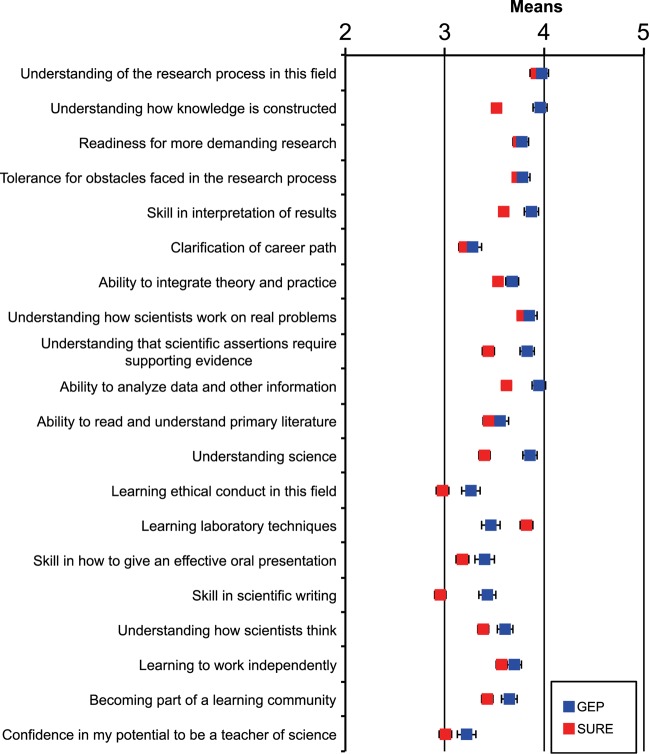
Figure 4.
Self-reported student learning gains using the SURE survey. Blue squares indicate the mean for GEP students, while red squares indicate the mean for SURE summer research students, 2009. Error bars represent two SEs below and above the means. The SE for the averages of the GEP and SURE responses was <0.04. Data shown combine results from surveys given in academic years 2010–11 and 2011–12; the data include between 652 and 751 responses on each of the 20 items from GEP students. The comparison group is the 2009 SURE survey of 1653 students who had just completed a summer in the lab. The large number of students allows for smaller error estimates than in our previous study (Lopatto et al., 2008).

