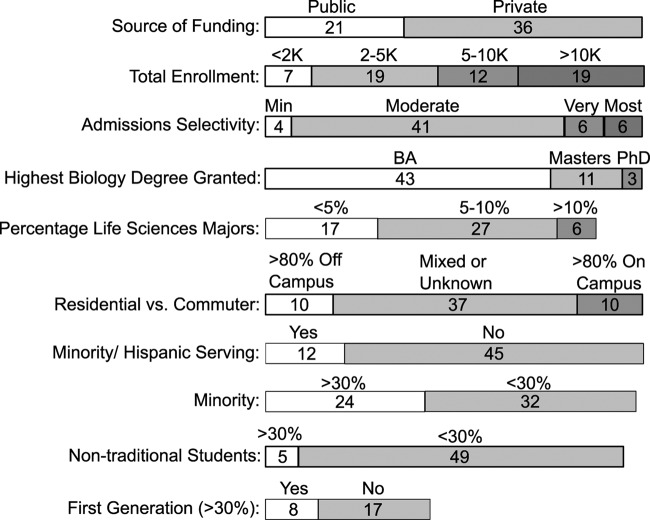
Figure 6.
Diversity of GEP institutions with students participating in the above assessment during 2010–2011 and 2011–2012. For the purposes of this survey, nontraditional students are defined as those over age 25. Total number of schools represented is 57. Some schools do not collect some of the above data, resulting in some incomplete data sets. Data from U.S. News & World Report Staff (2011) or supplied by the institution.

