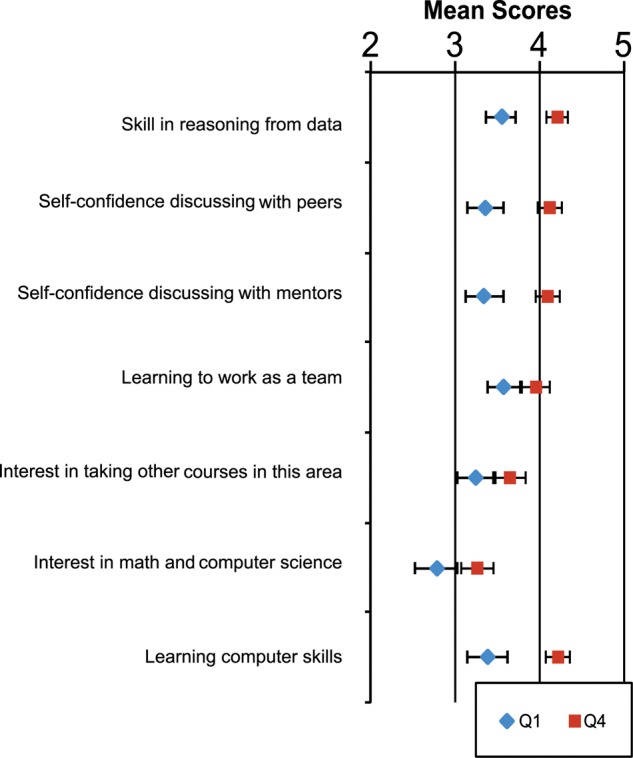
Figure 9.

Comparison of student responses on seven additional learning benefit items categorized by the reported number of hours of instruction and lab work on the annotation project (Q1: 1–10 h; Q4: > 36 h). The Q1 group includes 105–107 observations; the Q4 group includes 172–174 observations. (Respondents tallied here were those who answered the specific question.) The error bars represent two SEM.
