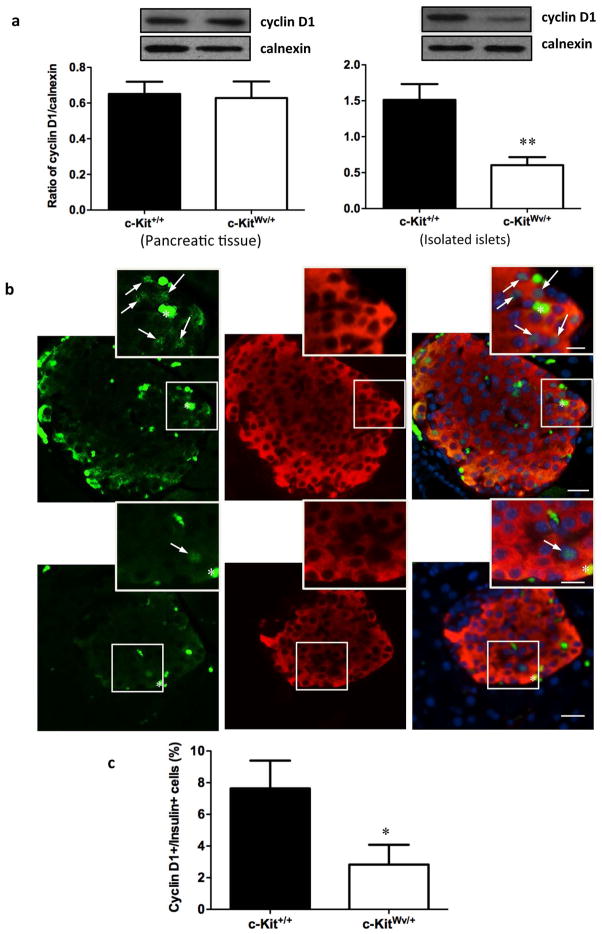
Figure 2. Decreased cyclin D1 protein level in isolated islet of c-KitWv/+ mice.
(a) Western blot analysis of cyclin D1 in the pancreas and isolated islets of c-Kit+/+ and c-KitWv/+ male mice at 8 week of age. Representative blots are shown. Data are normalized to loading control calnexin and expressed as means ± SEM (n=4 pancreas; n=6 isolated islets per experimental group) **p<0.01 vs. c-Kit+/+ male mice. (b) Double immunofluorescence staining for cyclin D1 (green), insulin (red) of c-Kit+/+ and c-KitWv/+ male mice pancreatic section at 8 week of age. Nuclear counter stained by DAPI (blue). Scale bar: 20μm (inset: 10μm). Arrows indicate cyclin D1/insulin double positive cells. (c) The percent of cyclin D1+ cells in β-cells of c-Kit+/+ and c-KitWv/+ male mice at 8 week of age. Data are expressed as mean percent positive cells over insulin+ cells ± SEM (n=6) *P<0.05 vs. c-Kit+/+ male mice.

