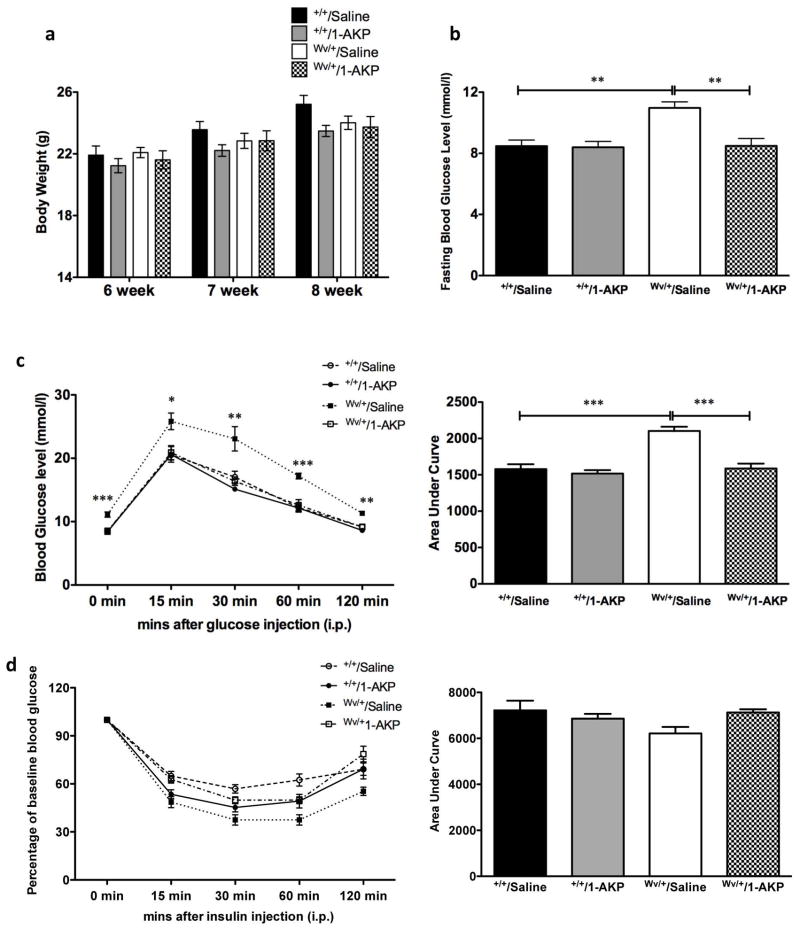
Figure 3. Effect of Gsk3β inhibitor on glucose homeostasis of c-KitWv/+/1-AKP mice.
Body weight (a) and fasting blood glucose level (b) of c-Kit+/+/saline, c-Kit+/+/1-AKP, c-KitWv/+/saline, and c-KitWv/+/1-AKP groups. Intra-peritoneal glucose tolerance test (IPGTT) (c) and insulin tolerance test (IPITT) (d) in c-Kit+/+/saline, c-Kit+/+/1-AKP, c-KitWv/+/saline, and c-KitWv/+/1-AKP mouse group. Glucose responsiveness of the corresponding experimental groups is shown as a measurement of area under the curve (AUC) of the IPGTT or IPITT graphs with units of [(mmol/L). min] shown on the Y-axis. Data are expressed as means ± SEM (n=6–8) *P<0.05, **P<0.01 ***P<0.001 vs. c-KitWv/+/saline group.

