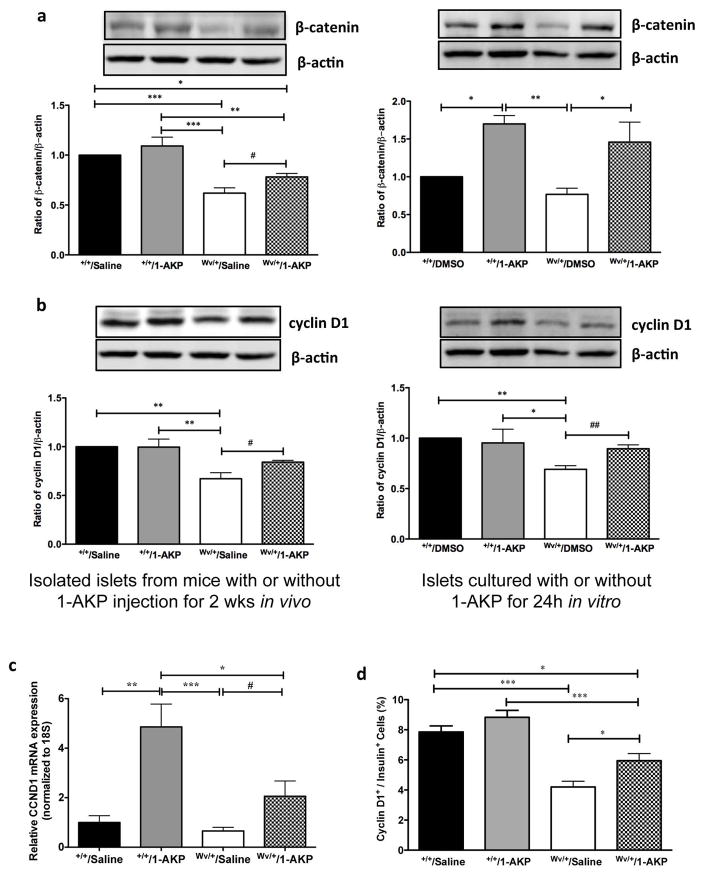
Figure 6. Inhibition of Gsk3β maintained β-catenin and cyclin D1 protein level in c-KitWv/+/1-AKP mouse islets.
Western blot analysis of β-catenin (a) and cyclin D1 (b) in isolated islets from c-Kit+/+/saline, c-Kit+/+/1-AKP, c-KitWv/+/saline, and c-KitWv/+/1-AKP mice (left column) and isolated islets from 8 weeks of c-Kit+/+ and c-KitWv/+mice cultured with or without 1-AKP treatment for 24h (right column). Representative blots are shown. Data are normalized to β-actin and expressed as means ± SEM (n=4–5) *P <0.05, **P<0.01, ***P<0.001 vs. c-KitWv/+/saline groups by one-way ANOVA analysis. #P<0.05, ##P<0.01 was analyzed by unpaired student t-test between c-KitWv/+islets with or without 1-AKP treatment. Quantitative analysis of cyclin D1 (CCND1) mRNA in isolated islets (c) and the number of nuclear cyclin D1+ cells in β-cells (d) of c-Kit+/+/saline, c-Kit+/+/1-AKP, c-KitWv/+/saline, and c-KitWv/+/1-AKP mice. Data are expressed as means ± SEM (n=5–8). *p<0.05, **p<0.01, ***p<0.001 vs. c-KitWv/+/saline group by one-way ANOVA analysis. #P<0.05 was analyzed by unpaired student t-test.

