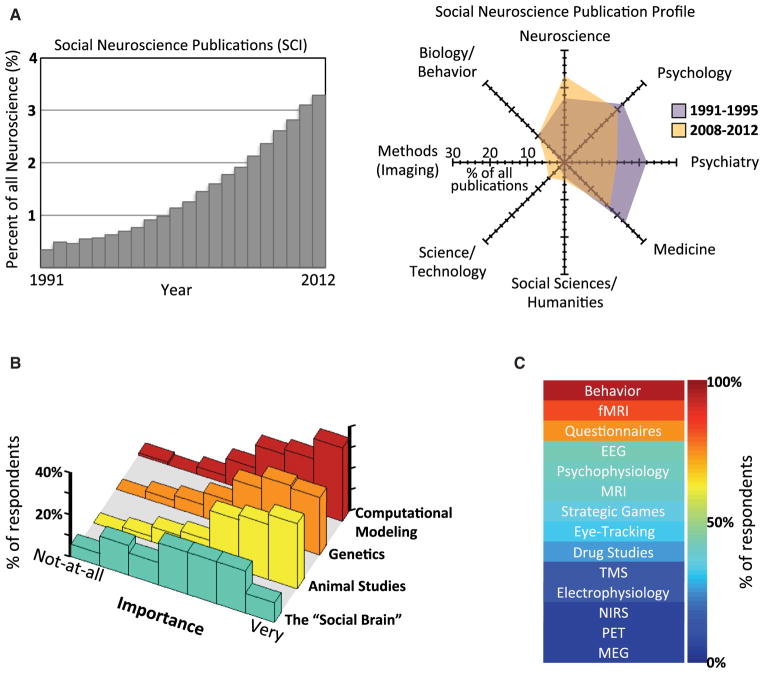
Figure 1. What Is Social Neuroscience?
(A) Metrics of publications over the years. Left: The graph plots the proportion of publications in social neuroscience relative to those in all of neuroscience, using Web of Science and methodology described in Matusall et al. (2011) (updated). Right: Past and current emphases in social neuroscience, obtained by mapping publications in social neuroscience onto the topics shown (see Matusall et al., 2011 for details).
(B) How important to social neuroscience are four major themes (differently colored rows)? The figure shows histograms of the distribution of online responses obtained from ca. 85 members of the Society for Social and Affective Neuroscience (SANS) and the Society for Social Neuroscience (S4SN).
(C) The methods (in rank order) used by social neuroscientists; data from the same respondents as in (B). Abbreviations are as follows: functional magnetic resonance imaging (fMRI), electroencephalography (EEG), magnetic resonance imaging (MRI), transcranial magnetic stimulation (TMS), near infrared spectroscopy (NIRS), positron emission tomography (PET), and magnetoencephalography (MEG).

