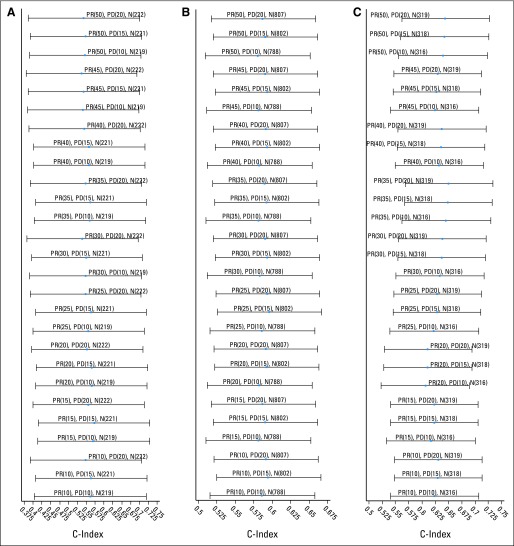
Fig 3.
Forest plots of the concordance indices (c-indices) and the associated 95% CIs for (A) breast cancer, (B) non–small-cell lung cancer, and (C) colorectal cancer using alternate partial response (PR) and progressive disease (PD) cut points for overall survival with the trichotomous tumor response metric on the validation data sets. N(x), number of patients evaluable for the respective analysis.

