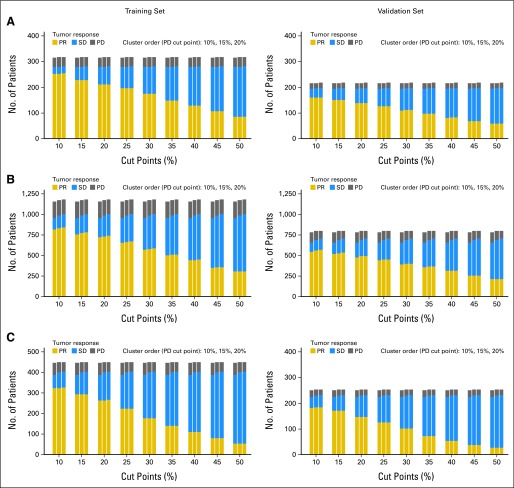
Fig A3.
Frequency distribution of the numbers of patients with (A) breast cancer, (B) non–small-cell lung cancer, and (C) colorectal cancer, by tumor type, on the basis of the 12-week data set that fall under the categories of partial response (PR), stable disease (SD), and progressive disease (PD) based on the different alternative cut points for PR and PD.

