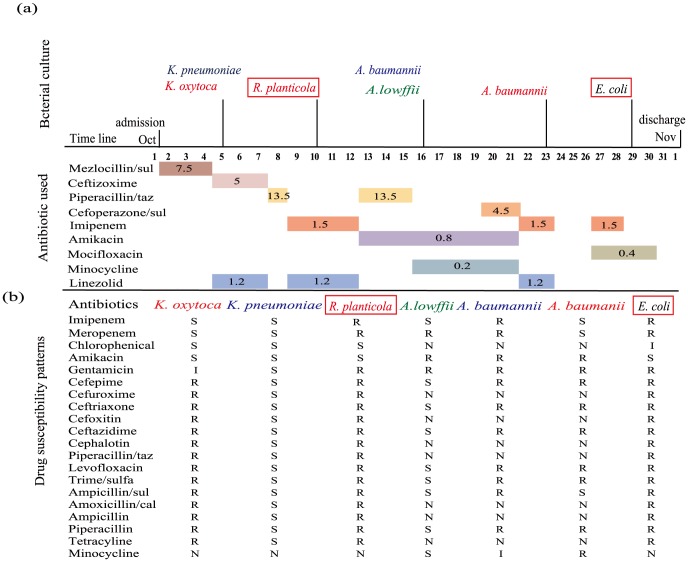
Figure 1. Time line of antibiotics treatment, microbiological investigation and isolation of NDM-1 positive R. planticola and E. coli.
(a): Time line of events during the 34-day hospitalization of the patient. Bacterial species isolated at a particular time point are shown above the time line while antibiotics used and their durations are marked below the time line. The sources of strains are colour coded: red, from blood; blue, from sputum; green: from urine; black, from feces. Red boxed: NDM-1 positive bacteria. The number in bracket after a given antibiotic is dosage of the antibiotic used (g/day). (b): Antibiotics resistance profiles of bacteria isolated. Interpretation of results: S, susceptible; I, intermediate; R, resistant; N, not done.

