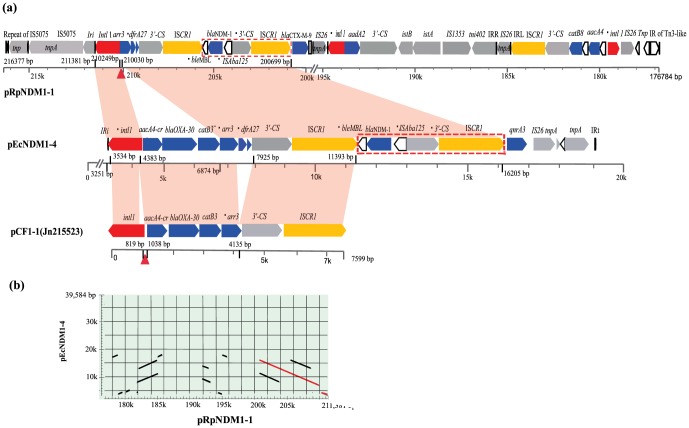
Figure 3. Schematic representation of the DNA sequences surrounding the bla NDM-1 in plasmid pEcNDM1-4, pRpNDM1-1 and homologous sequences in plasmid pCF1-1 to illustrate the relationship of the three plasmids.
(a): Illustration of the adjacent genes of NDM-1-ISCR1 of pRpNDM1-1, pEcNDM1-4 and homologous sequences in plasmid pCF1-1. Arrows represent ORFs and their direction of transcription; Filled triangles show the same 218 bp insertion in pCF1-1 and in pRpNDM1-1, compared with pEcNDM1-4; Open rectangle represent hypothetical proteins between bla CTX-M-9 and IS26 in plasmid pRpNDM1-1; Pink shades across the plasmids indicates more than 99% identity between sequences. (b): MUMer-based genomic display between pEcNDM1-4 and pRpNDM1-1. The corresponding homologous sequences represented in (a) were highlighted in red lines.

