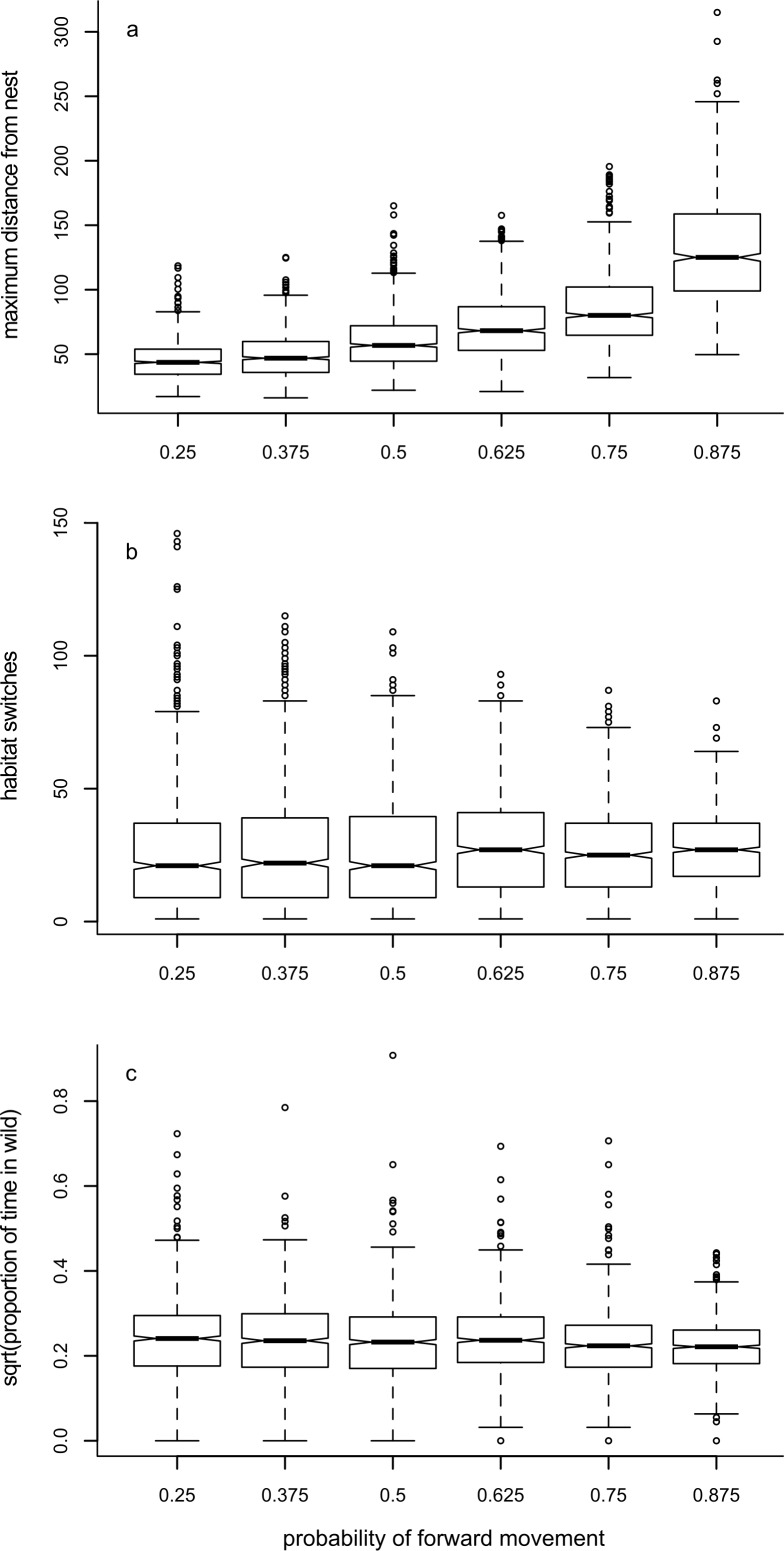
Figure 3. Box plots showing trends for Model 1.
Box plots show the effects of changing the probability of moving forwards in a period (pF) on the median value of: (A) maximum distance travelled away from the nest in 1000 movements; (B) the number of times the forager changes habitat; and (C) the proportion of time the forager spends in the ‘wild’ habitat.

