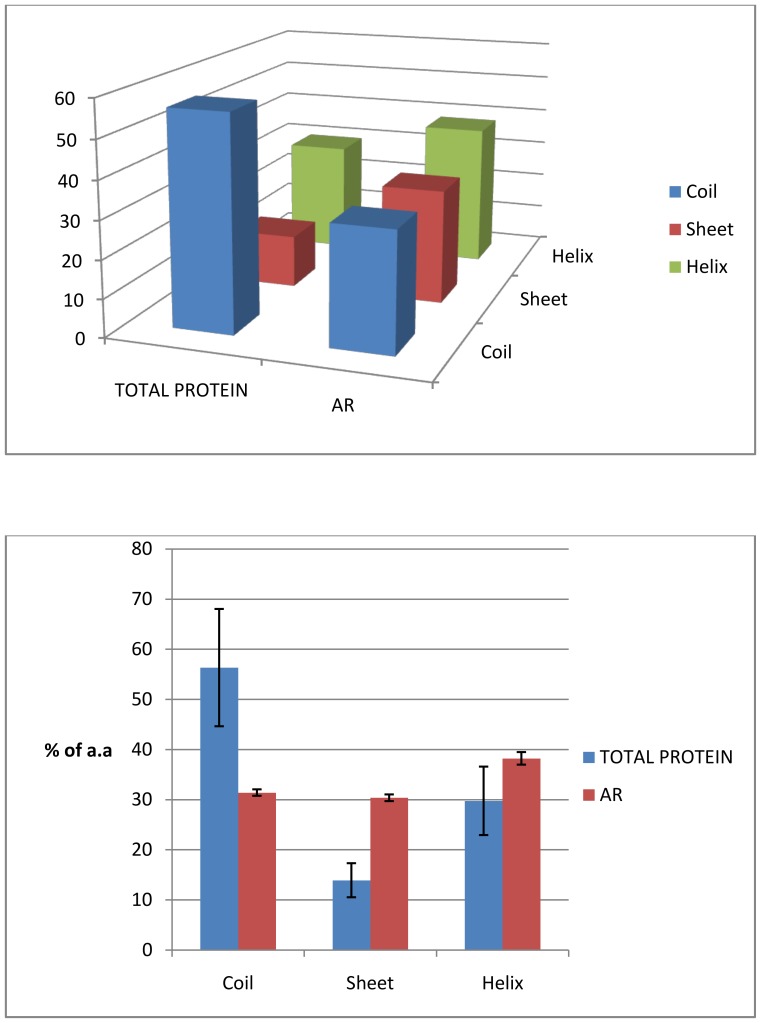
Figure 6. Comparison of the conformational preferences of residues in the ARs with that of total protein.
A 3D plot shows the percentage of residues with conformational preference for α-helix (green), β- strand/sheet (red) and coil (blue) for total proteins and their ARs as represented in X-axis. Lower panel shows the 2D plot of the above data along with the error limits.

