
Figure 2. Telomerase inhibition induces RAD51 expression and its binding to telomeres.
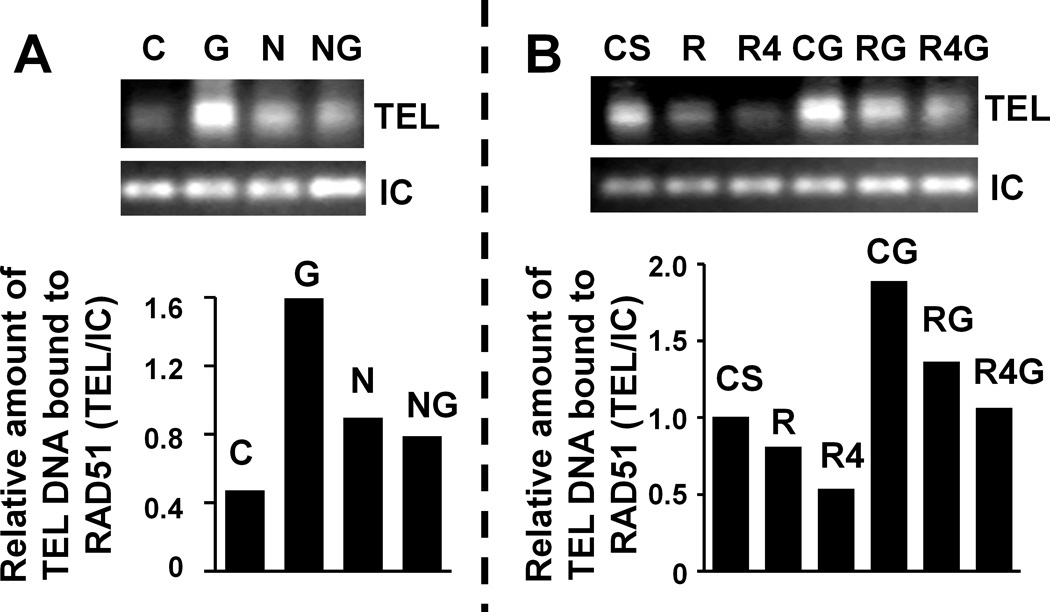
(A) OE33 cells, untreated or treated for 48 hrs with mismatch control (C; 2 µM), GRN163L (G; 2 µM), HR inhibitor nilotinib (N; 5 µM), and combination of N and G (NG) were processed as described above. Top panel is the gel image showing RAD51-bound telomere (TEL) and internal control (IC) bands, whereas bottom is the bar graph showing relative amount of telomeric DNA bound to RAD51 following normalization with internal control DNA. (B) OE33 cells treated with control shRNA (CS), RAD51 shRNA (R), RAD51 shRNA mediating stronger suppression of RAD51 (R4), CS cells treated with GRN163L (CG), R cells treated drug (RG), or R4 cells treated with drug (R4G) were processed as described above. Top panel shows gel image of telomere (TEL) and internal control (IC) bands, whereas bottom is the bar graph showing relative amount of telomeric DNA bound to RAD51 following normalization with internal control DNA.