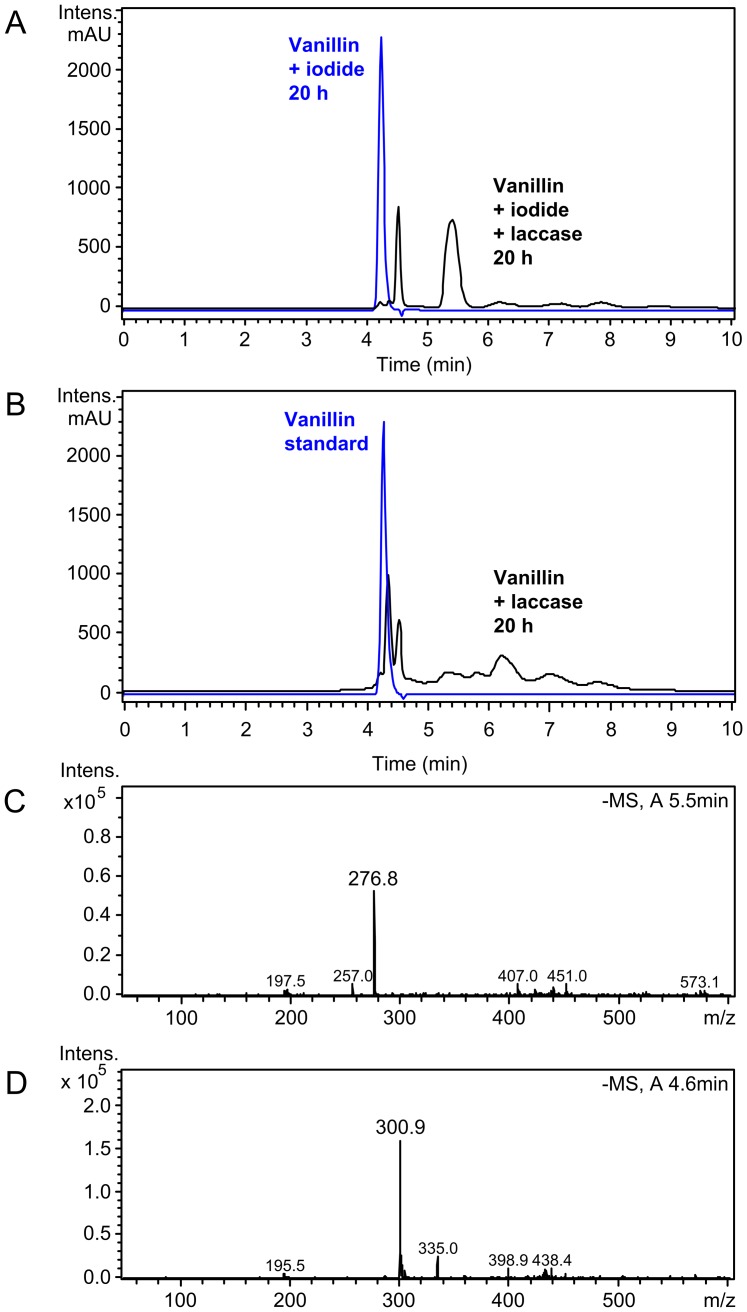
Figure 3. HPLC-MS analysis of vanillin biotransformations.
(A) Overlay of UV chromatograms (absorbance at 275 nm) of ethyl acetate extracts of a laccase-iodide-vanillin biotransformation (black trace) and a laccase-free control reaction (blue trace). (B) Overlay of UV chromatograms (275 nm) of ethyl acetate extracts of a laccase-vanillin biotransformation (black trace) and a vanillin standard (1 mM, in ethyl acetate). (C) Mass spectrum for the major product peak of A with a retention time of 5.2–5.6 min. (D) Mass spectrum for the first product peak of A with a retention time of 4.4–4.6 min.

