
Figure 3. miR-26a is markedly decreased in NPM-ALK+ T-cell lymphoma, and its restoration decreases iNOS protein expression.


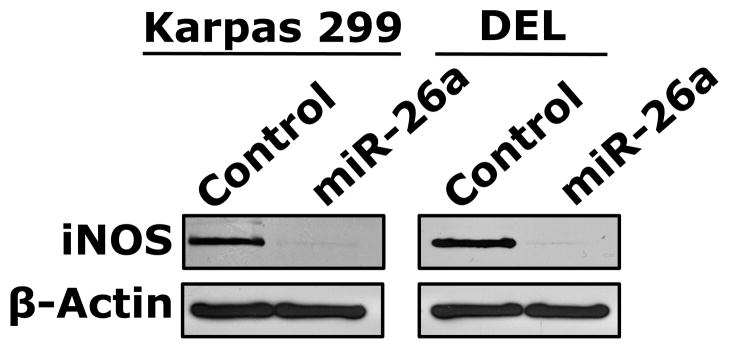

(A) In the upper panel, microRNA array heat map illustrates the expression of microRNA in the NPM-ALK+ T-cell lymphoma cell lines and T lymphocytes (yellow/orange/red = upregulated; blue/green = downregulated). The red arrow marks miR-26a that ranks 12th top microRNA downregulated in the NPM-ALK+ T-cell lymphoma cell lines versus T-cells (p = 0.000003). The lower panel shows potential binding sites between miR-26a and iNOS 3′-UTR; (B) qPCR shows miR-26a is decreased in the NPM-ALK+ T-cell lymphoma cell lines and ALK+ T-cell lymphomas compared with T lymphocytes, reactive lymph nodes and ALK-negative ALCL tumors (*: p < 0.05, **: p < 0.01 vs. T lymphocytes, reactive lymph nodes, and ALK-negative tumors, †: p < 0.05 vs. reactive lymph nodes); (C) WT miR-26a significantly decreased the luciferase activity of iNOS 3′-UTR, and MT miR-26a that lacked the binding sites with iNOS 3′-UTR failed to induce a similar effect (*: p < 0.0001); (D) In the upper panel, miR-26a remarkably decreased the levels of WT iNOS transfected into 293T cells and failed to induce a similar effect on MT iNOS that lacked 3′-UTR. Vertical lines indicate repositioned gel lanes. In the lower panel, densitometry shows a marked decrease in the iNOS:β-actin ratio when miR-26a was transfected with WT iNOS, but not with MT iNOS, into 293T cell line; (E) WB shows that transfection of miR-26a decreased endogenous iNOS protein in Karpas 299 and DEL cells; (F) but did not change iNOS mRNA in these cells. For results presented in D, E, and F, cel-miR-67 was used as a negative control. The results shown in B, C, and F represent the means ± SE of 3 different experiments performed in quadruplet.