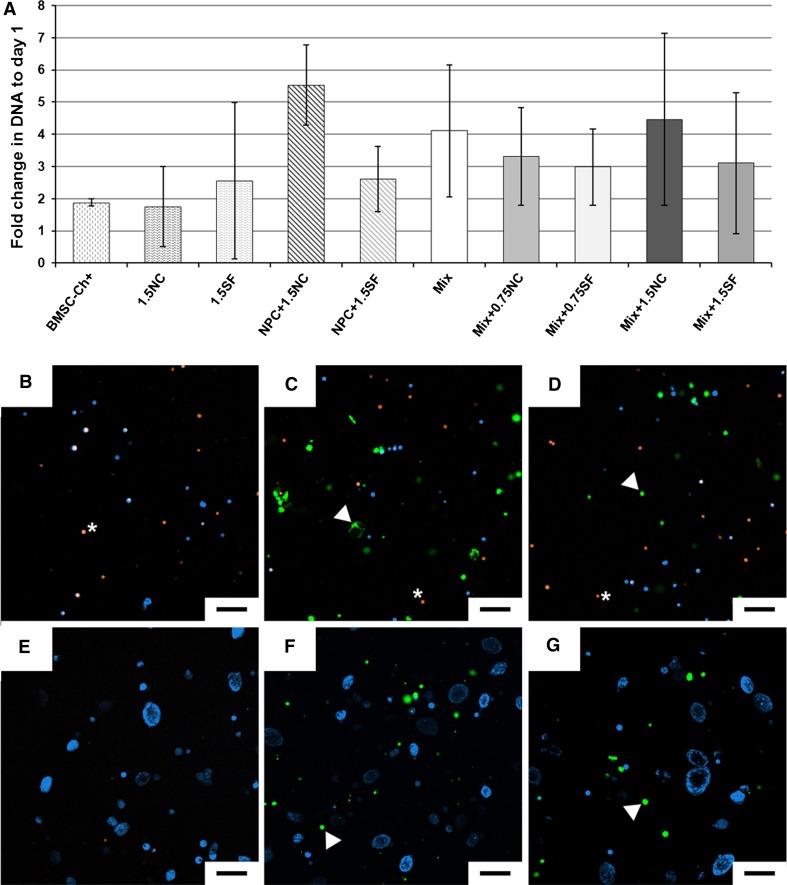
Fig. 1.
Cell viability and proliferation assessment. a DNA fold change at day 28 relative to day 1. Values are mean ± standard deviation; N = 4 per group. b–g Cell viability and morphology at days 1 (b–d) and 28 (e–g). Cells were stained with calcein (blue fluorescence). Before seeding NPCs were prestained with orange CMTMR (orange fluorescence; star) and NCs/SFs prestained with Vybrant (green fluorescence; arrow head). b, e Mix; c, f Mix +1.5NC; d, g Mix +1.5SF. Representative of four repeats per group. Scale bar is 100 μm

