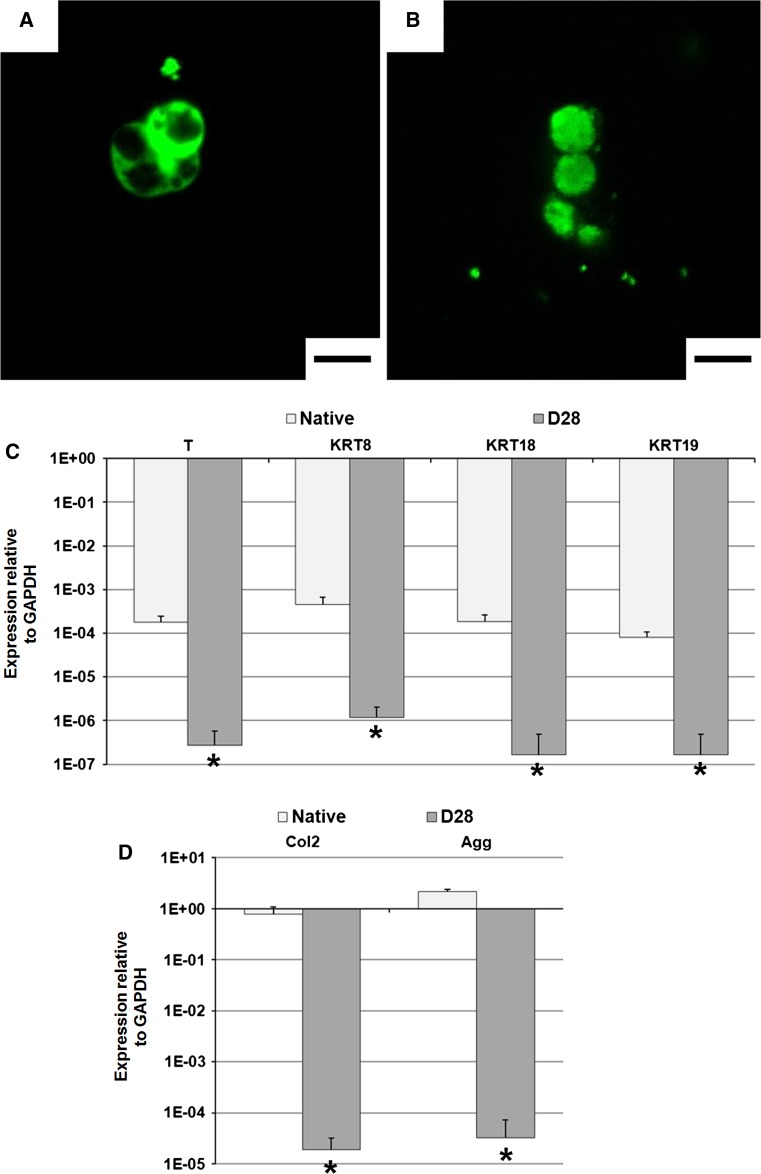
Fig. 4.
NC phenotype. Cell morphology was assessed at days a 1 and b 28 using confocal imaging. NCs were prestained with Vybrant (green fluorescence) before seeding. Representative of 4 repeats per group. Scale bar is 20 μm. c Brachyury (T), cytokeratin-8/-18/-19 (KRT8/18/19) and d type II collagen (COL2A1) and aggrecan (ACAN) gene expression relative to GAPDH (2−∆Ct method) in native tissue and after 28 days of culture. Values are mean + standard deviation; N = 4 for day 28; N = 6 for native tissue. *p < 0.05 as compared to native tissue. Please note the logarithmic scale for both means and standard deviations

