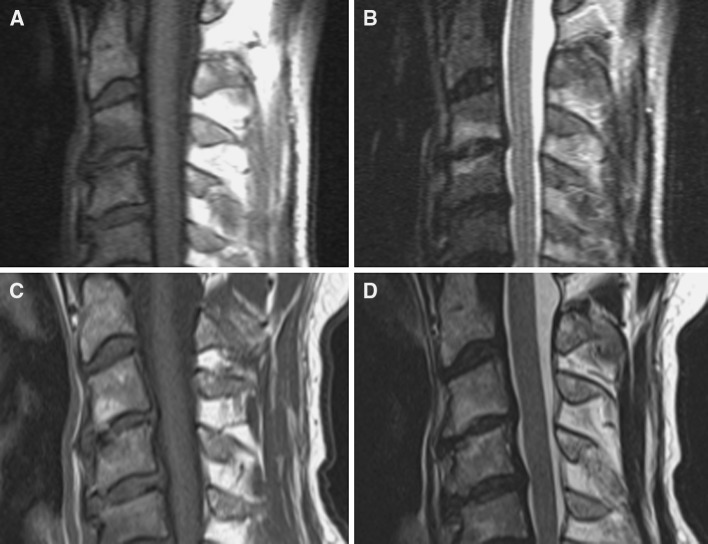
Fig. 1.
a, b Baseline MRI [17]: endplate marrow changes Modic type 1 in the motion segment C3/4 presented as low signal in T1-weighted and high signal in T2-weighted sequences. c, d Follow-up MRI of the same patient shows the evolution of Modic change type 1 to type 2 seen as high signal in both T1- and T2-weighted sequences

