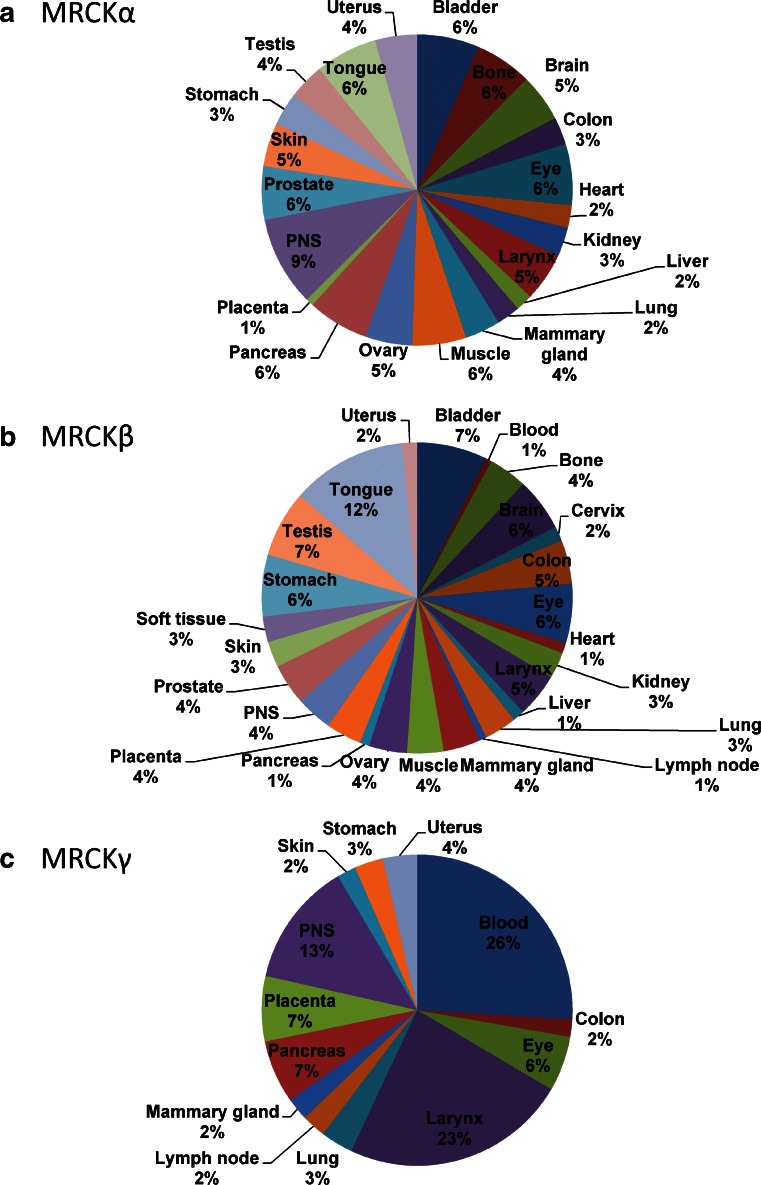
Fig. 2.
Tissue distribution of MRCK determined from expressed sequence tags (EST). a MRCKα, b MRCKβ and c MRCKγ relative expression levels were derived from the Tissue-specific Gene Expression and Regulation (TiGer) database (http://bioinfo.wilmer.jhu.edu/tiger). The expression levels were normalized with tissue-library size. Each value for a gene in a tissue is a ratio of observed ESTs to the expected one in this tissue. The expected number of ESTs is the product of total ESTs of the gene and the fraction of total ESTs in the tissue among all ESTs in 30 tissues. To depict tissue expression profiles, the normalized expression levels were graphed as percentages from only those tissues having values >0

