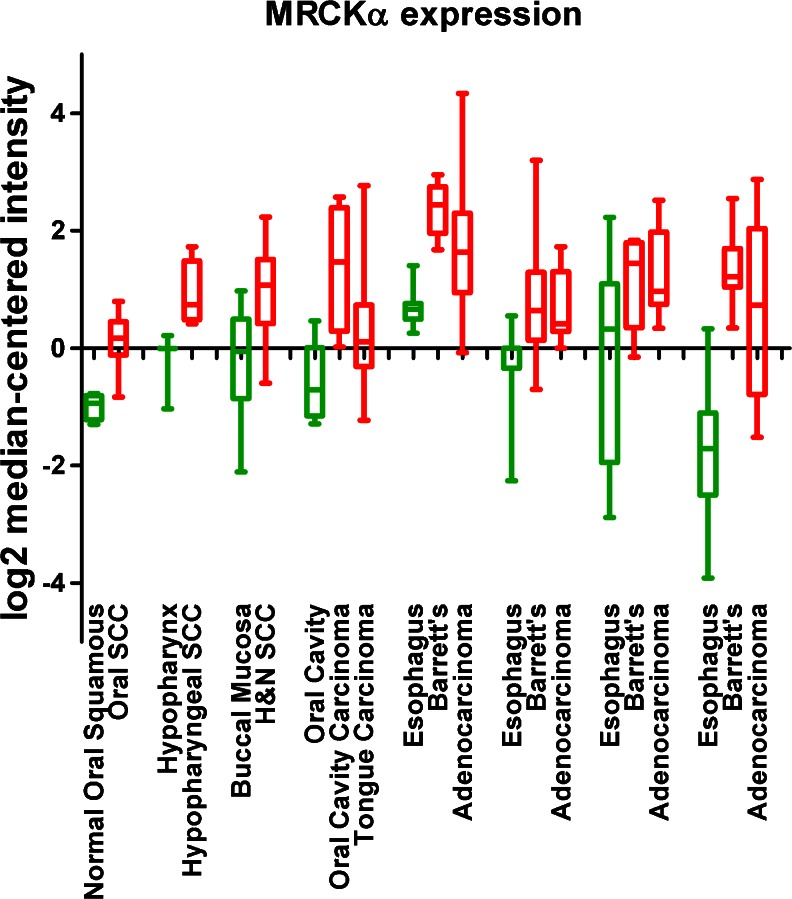
Fig. 5.
MRCKα expression in carcinomas and Barrett’s esophagus. Analysis of publicly available gene expression microarray data using Oncomine revealed significantly increased MRCKα levels (red) in oral, hypopharyngeal, head and neck squamous cell carcinoma, oral cavity and tongue carcinoma, Barrett’s esophagus and esophageal adenocarcinoma relative to matched normal tissue (green). Box represents upper and lower quartiles with line at median, whiskers indicate maximum and minimum values

