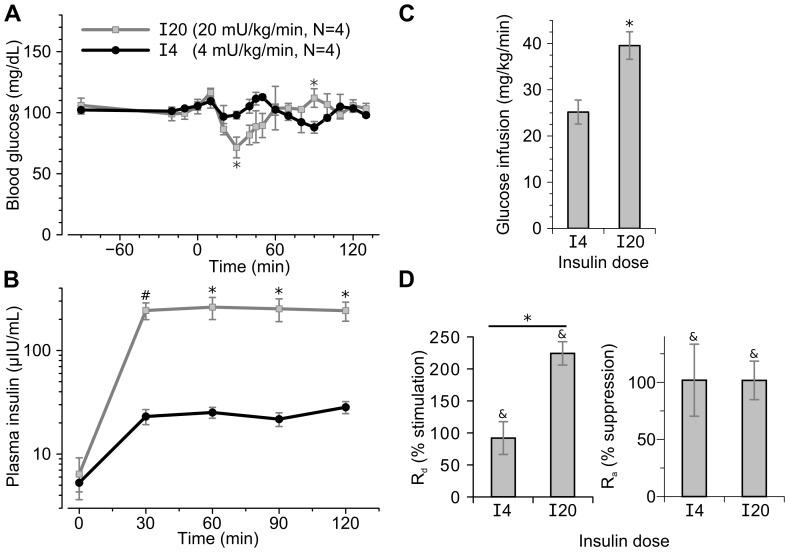
Figure 2. Traced euglycemic hyperinsulinemic clamp at differing insulin doses.
Insulin was infused at 4 (“I4”, black lines) or 20 (“I20”, grey lines) mU/kg/min starting at 0 minutes in conscious, minimally restrained ferrets. 6,6-D2-glucose was infused throughout the clamp starting at −90 minutes. (A) Blood glucose levels during the clamps. (B) Plasma insulin levels during the clamps measured by Calbiotech ELISA kit. (C) Glucose infusion rates during the final 20 minutes of the two clamps. (D) Left panel, stimulation of glucose disposal rates (Rd) during the clamp as compared to basal rates; right panel, suppression of glucose appearance (Ra) rates during the clamp as compared to basal rates. Statistics: * p<0.05 I20 versus I4 infusions, # p<0.005 I20 versus I4 infusions; & p<0.05 clamped (100–120 min) rate versus basal (−20–0 min).

