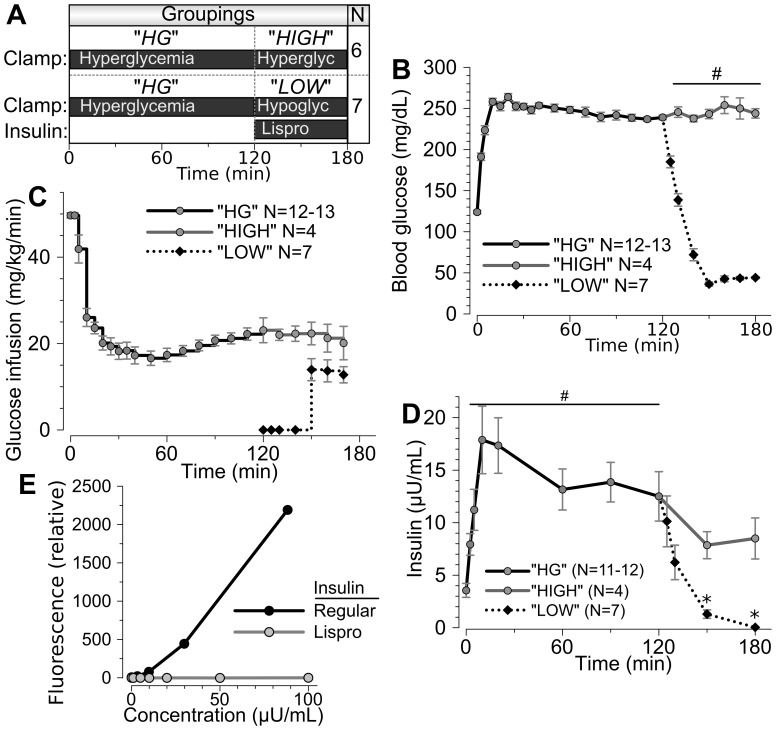
Figure 3. Hyperglycemic clamps in ferrets, also testing hypoglycemic responsiveness.
(A) All ferrets were subject to 120 minutes of hyperglycemic clamp (HG, N = 13). At 120 min, a portion (LOW, N = 7) of the ferrets underwent insulin lispro infusion and hypoglycemic clamp, while the remaining ferrets (HIGH, N = 6) underwent continued hyperglycemic clamp. (B) Blood glucose levels. (# p<0.0001, LOW versus HIGH group for the indicated time points). (C) Glucose infusion rates. (D) Serum ferret insulin levels during clamp studies. (* p<0.05 both versus 120 minutes and LOW versus HIGH; # p<0.01 versus baseline.) The HIGH group insulin levels were measured by Calbiotech insulin ELISA assay that also reacts with insulin lispro. The LOW group insulin levels were measured by immunobead fluorescence multiplex assay that does not recognize insulin lispro. This immunobead assay was used to achieve greater sensitivities for lower insulin levels. (E) Fluorescence intensities resulting from regular and lispro insulin using an immunobead fluorescence multiplex assay. See Supplemental Figure S2 for additional details.

