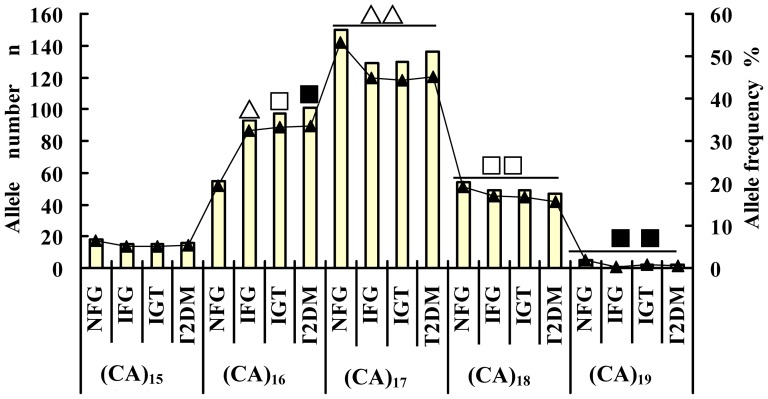
Figure 3. Frequency distribution of rs10886471 (CA)n alleles in the four groups.
Not all comparisons are shown. The allelic frequencies of (CA)16 in the IFG, IGT, and T2DM groups wasmuch higher than that in the NFG group (△ X 2 = 12.300, P = 0.000; □ X 2 = 13.672, P = 0.000;▪ X 2 = 14.476,P = 0.000, respectively). The allelic frequency of (CA)16 was significantly lower than that of (CA)17, but higher than those of (CA)18 and (CA)19 among the four groups (△△ X 2 = 16.190, P = 0.001; □□ X 2 = 10.221,P = 0.017; ▪▪ X 2 = 8.265, P = 0.041, respectively).

