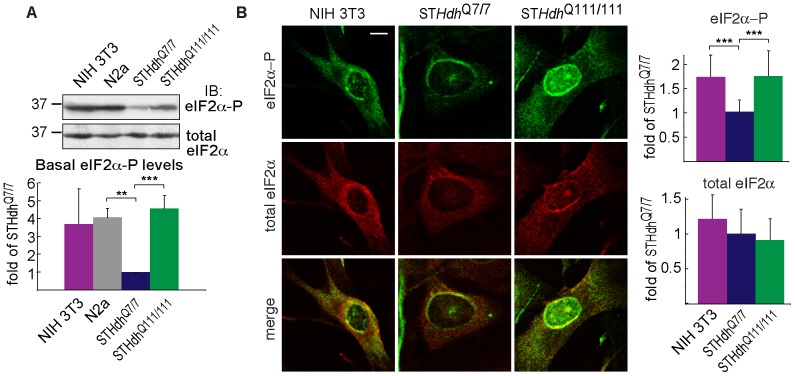
Figure 2. Very low eIF2α-P levels in striatal cells, much increased by expression of Htt111Q.
A) Basal level of eIF2α-P in murine cell lines normalized by total eIF2α. Graph: average of 3 experiments ± SE. **P = 0.004, ***P = 0.001. B) Immunofluorescence images of cells fixed, permeabilized and stained with rabbit anti-eIF2α-P and mouse anti-eIF2α followed by secondary antibodies. Bar = 10 µm. Image exposure time was kept constant to be able to compare protein levels in the different cell types. Levels relative to STHdh Q7/7 levels were quantified from images from 3 experiments ± SE (>20 cells, ***P<0.001).

