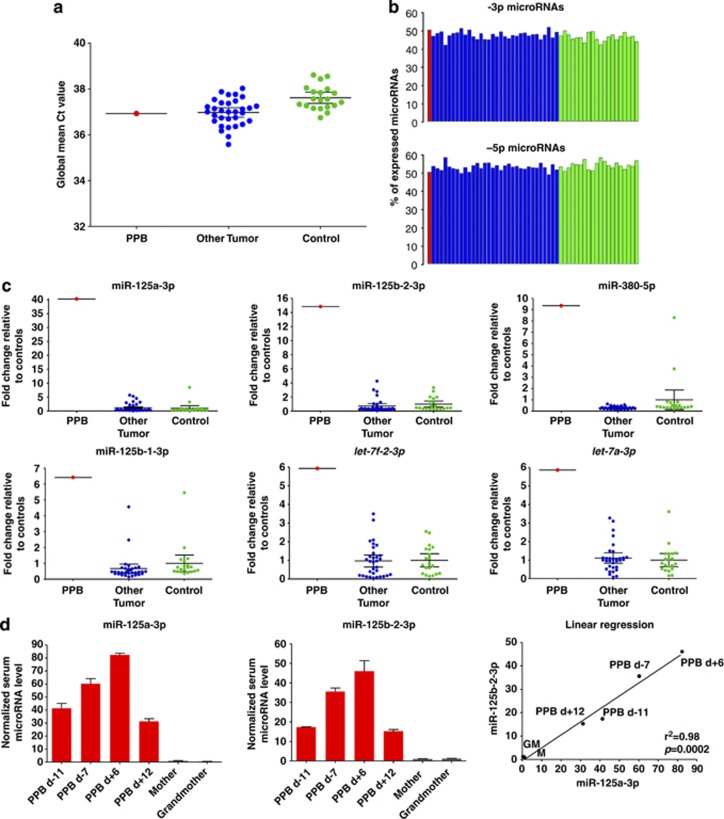
Figure 2.
Serum mature microRNAs in the DICER1-mutated PPB case. (a) The graph shows global mean Ct values for serum mature microRNAs (n=568) in the PPB case at the time of diagnosis (red; left) compared with mean values for the reference tumors of childhood (without a family history suggestive of germline DICER1 mutations) (n=32; blue; center) and age- and gender-matched control samples from subjects without malignancy (n=20; green; right). Serum samples were processed10 before RNA extraction (miRNeasy Mini Kit; Qiagen, Crawley, UK), as described.25 The RNA eluate was used for universal reverse transcription using miRCURY-LNA microRNA reagents (Exiqon, Vedbaek, Denmark). The universal cDNA was diluted 50 × , before quantitative reverse transcription polymerase chain reaction (qRT–PCR) for 741 human microRNAs using the Exiqon microRNA Ready-to-Use PCR Human-Panels I and II in a LightCycler 480 Real-Time-PCR System (Roche, Welwyn Garden City, UK), including spike-in controls for quality control. MicroRNAs with Ct values ⩽37 were considered expressed. Samples had no evidence of significant hemolysis, by visual inspection and analysis of miR-451 levels, as described.26 Data were normalized using the global mean method, that is, the average Ct value of microRNAs expressed in at least one of the 53 samples analyzed (n=568), as described.27 MicroRNA levels were then quantified using the delta Ct method. MicroRNAs that had a ⩾2.0 fold change in expression in the PPB case compared with the mean expression value from a) the control group and b) the ‘other tumor' group were considered overexpressed. (b) The graph shows the expression of -3p (top panel) and -5p (lower panel) microRNAs as a percentage of the total number of expressed microRNAs. The PPB case at the time of diagnosis (red column) is compared with percentages for individual ‘other tumor' samples (blue) and controls (green). Only expressed microRNAs with both -3p and -5p probes present on the Exiqon qRT–PCR platform (n=286) were considered for this analysis. (c) Levels of the six top-ranking most abundant microRNAs (from Table 1) for the DICER1-mutated PPB sample (red) when compared with other childhood tumor samples (blue) and controls (green). (d) The graphs show separate validation of the normalized serum levels of miR-125a-3p (left) and miR-125b-2-3p (center) and linear regression of these two microRNAs (right) in four longitudinal serum samples from the PPB case (red) and from serum from relatives with the same germline DICER1 mutation (mother and maternal grandmother; gray). For this work, the non-human spike-in microRNA cel-miR-39-3p was used for quality control, before levels were normalized using three independently transcribed housekeeping microRNAs that were identified in the global study as having the most stable expression in the serum across the whole cohort (miR-191-5p, miR-30b-5p and miR-30c-5p). This independent qRT–PCR was performed using Taqman reagents and assays (Applied Biosystems, Warrington, UK) as per the manufacturer's instructions using a Realplex Mastercycler epgradient S (Eppendorf, Stevenage, UK). Results were then referenced to serum microRNA levels from the mother. Time-points listed are relative to the start of chemotherapy treatment, assigned as d 0. d, Day; M, mother; GM, maternal grandmother.

