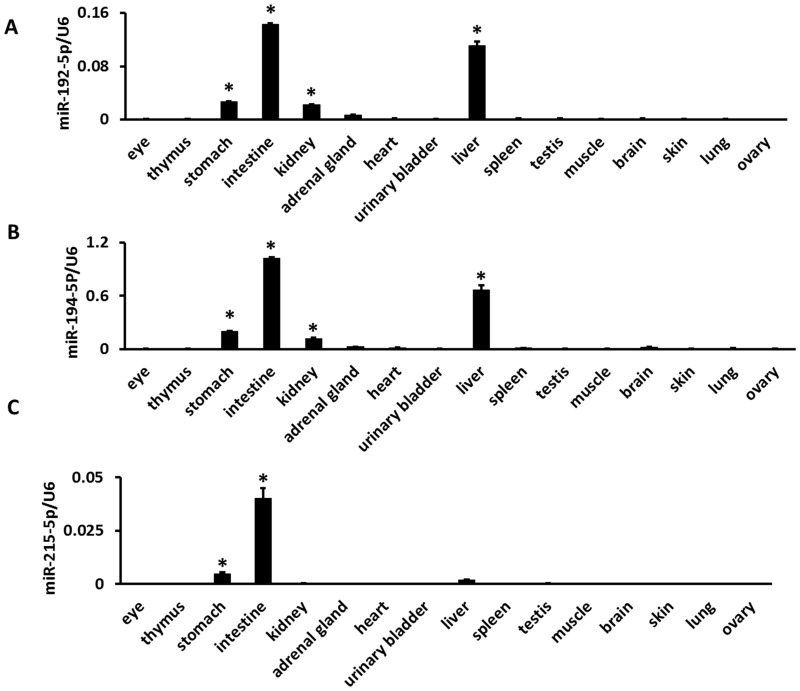
Figure 4. Expression of mature miRNAs in 16 mouse tissues.
Expression analysis was performed using real-time RT-PCR. The expression levels were normalized to U6 snRNA. (a) miR-194-5p expression, (b) miR-192-5p expression, (c) miR-215-5p expression. * Preferential expressed tissues identified by ANOVA (P<0.05) and Turkey's HSD test

