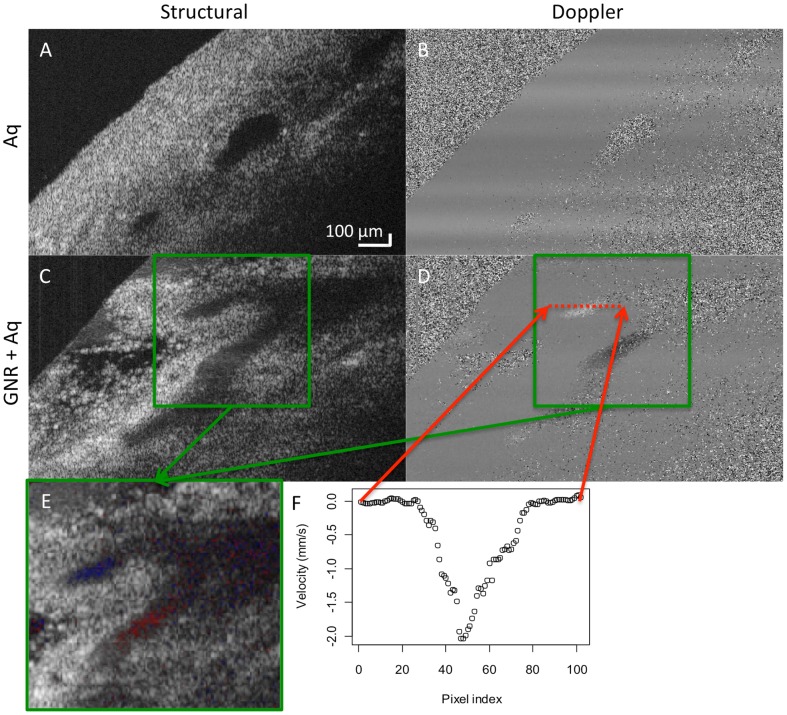
Figure 4. Ex-vivo Doppler imaging.
Structural and Doppler OCT scans of the outflow pathway in porcine eyes perfused with (A–B) mock aqueous (control, Aq) and (C–D) 1×10¹² gold nanorods/mL with mock aqueous (GNR+Aq). (E) Merged structural and Doppler scan corresponding to the location in the green box. Red and blue corresponds to flow away and towards the probe, respectively. (F) Velocity profile of the Doppler scans in the location corresponding to the red dotted lines.

