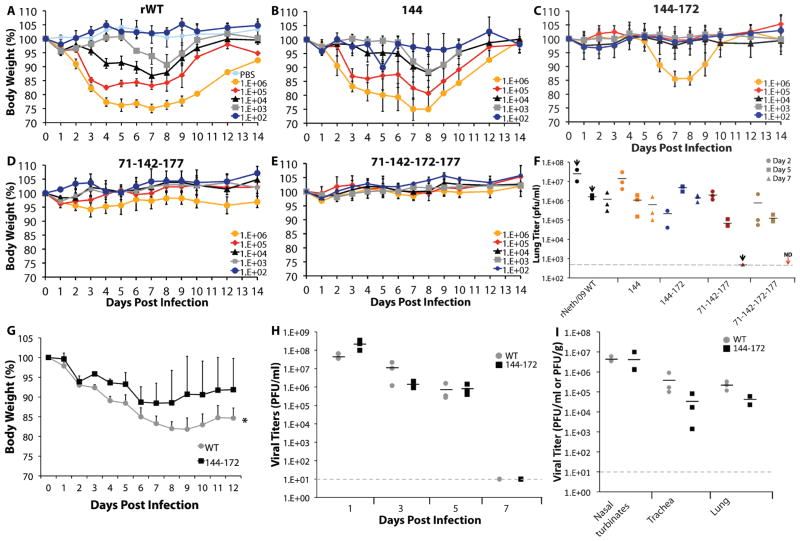
Fig. 4. 2009 pH1N1 viruses with additional glycosylations in the HA are attenuated in mice and ferrets.
(A – E) Infection of 9-week-old female C57B/6 mice with Neth/09 glycosylation mutant viruses. Groups of 5 mice per recombinant virus were infected i.n. with the indicated doses. Body weight represents the average of each group and the error bars indicate the +/− SD at each time point. (F) Viral titer in the lungs of mice infected with 1×10³ pfu of each mutant virus were obtained on days 2 (circle), 5 (square), and 7 (triangle) p.i. as shown. Black bars represent the average viral titer for 2 (arrows) or 3 mice per group at each time point as compared to the rNeth/09 WT virus. N.D. = Not detected. (G) Body weight changes in ferrets infected (n=3 per group) with the indicated viruses. Weights are shown as the average and the error bars represent the +/− SD. at each time point. Statistically significant difference (*) of the overall body weight of ferrets during the infection period was estimated with the Wilcoxon-matched pairs test. (H) Viral titers in nasal washes obtained every other day from ferrets shown in (G). (I) Viral load in tissues from ferrets (n=3) at day 3 p.i. with the indicated viruses. Values are represented as in (F).

