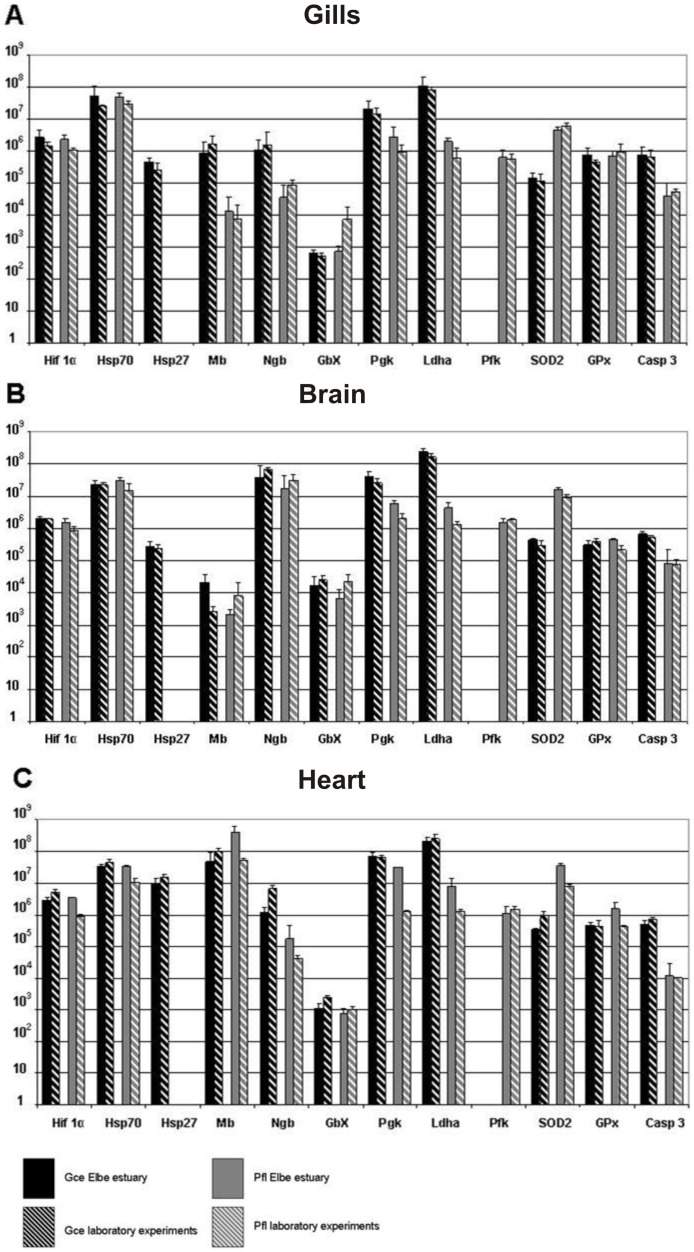
Figure 2. Interspecies and experimental site comparison of total mRNA copy numbers of putatively hypoxia responsive genes in ruffe and flounder under normoxic condition analysed in (A) gills, (B) brain and (C) heart.
All expression levels are referred to 1 µg mRNA. qRT-PCR results from the Elbe estuary are represented in black columns for ruffe and grey columns for flounder. Dashed columns indicate qRT-PCR results from laboratory experiments with black background for ruffe and grey background for flounder, respectively. Note that the y-axis has a logarithmic scale. Bars indicate standard deviation (SD). Asterisks indicate significance at p <0.05. N = 3 individuals for results from Elbe estuary for each data point. N = 3 (analysed with a nested experimental design) for results from laboratory for each data point.

