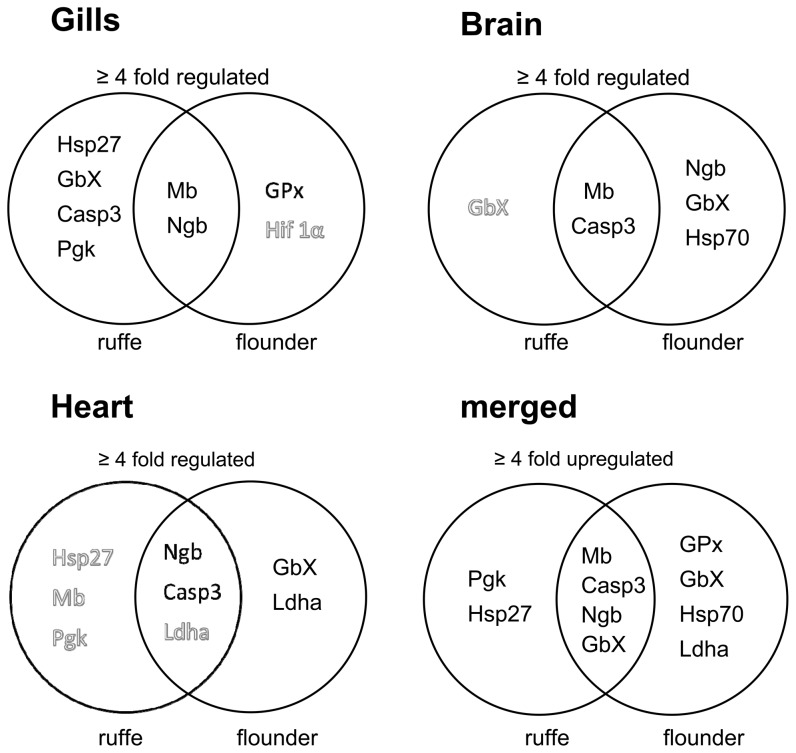
Figure 5. Venn diagram of expression changes in different tissues of ruffe and flounder.
Black letters indicate genes that are upregulated and white letters indicate genes that are downregulated. Merged Venn diagram shows an overview of genes regulated more than fourfold in an overall comparison of the collected data.

