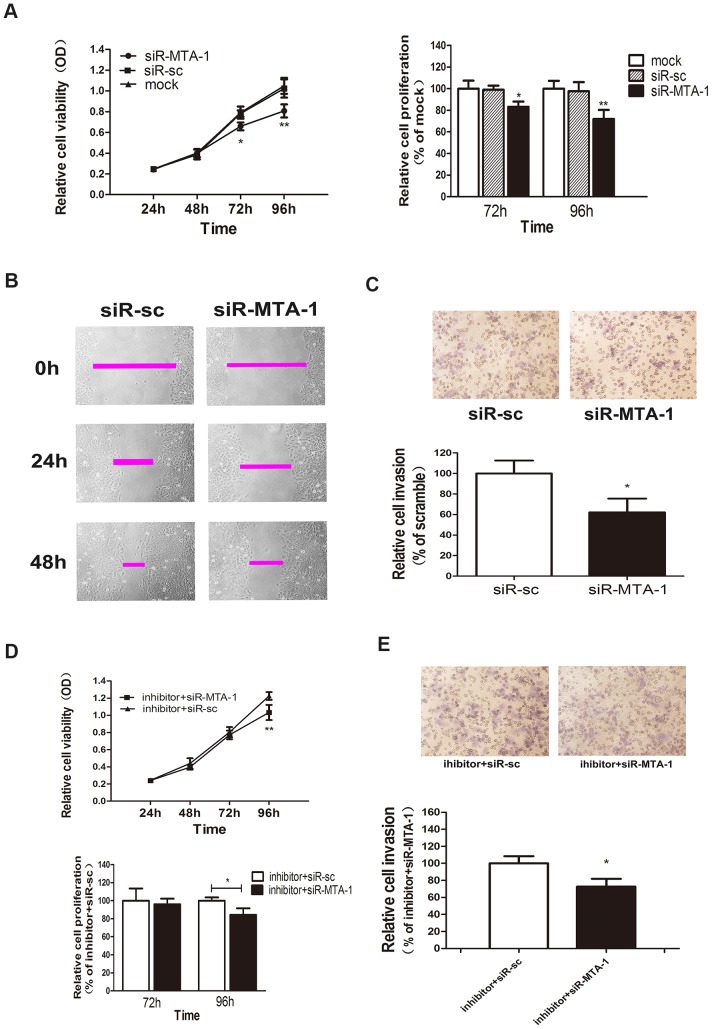
Figure 4. MiR-30c functions as a tumour suppressor through the miR-30c-MTA-1 signalling pathway.
(A). A MTT assay shows the cell viability (left) and relative cell proliferation (right) were repressed by transfection of siR-MTA-1 at 72 and 96 h. (B). Representative photographs of the wound-healing assay show the migratory ability of the transfected cells at 0, 24 and 48 h after wounding. (C). Representative photographs of cell invasion in a transwell assay. The average number of cells was counted from 5 random microscopic fields (×200). The values shown are the mean values ± SD of relative cell invasion. (D) and (E). Cotransfection of miR-30c-inhibitor and siR-MTA-1; cotransfection of miR-30c-inhibitor and siR-sc served as the control. (D). Compared with the control transfection, cell viability (upper) and relative cell proliferation (lower) was suppressed at 96 h. (E). Representative photographs of cell invasion in a transwell assay. The average number of cells was counted from 5 random microscopic fields (×200). The values shown are the mean values ± SD of relative cell invasion. The differences of relative cell proliferation between the groups appeared at 96 h after transfection. (*P<0.05, **P<0.01).

