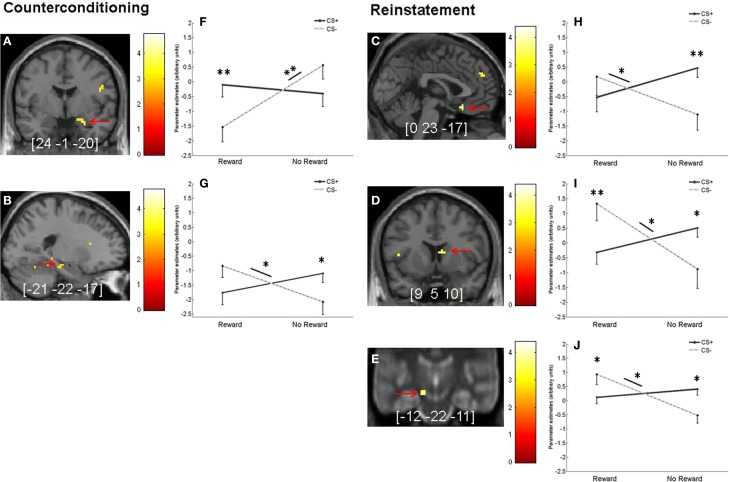
Figure 6.
Interaction of fear and reward during counterconditioning and reinstatement. (A,B) Interaction between reward status and previous fear association during counterconditioning in (A) right amygdala (p < 0.05, SVC) and (B) left hippocampus (on a trend level, p = 0.06, SVC). (C–E) Significant interaction (p < 0.05, SVC) between reward status and previous fear association during reinstatement in (C) OFC, (D) right caudate nucleus, and (E) left SN/VTA. (F–J) Mean parameter estimates (arbitrary units) from the peak voxels of the activations indicated by the red arrows in the left-hand panels broken down by CS type and reward status. To better localize SN/VTA activations, the corresponding panel displays an overlay onto an MT image (cf. methods section). Error bars represent standard error. Images are shown in neurological orientation at p < 0.005 (uncorrected), for visualization purposes. Color bars indicate T-values. Peak coordinates are given in MNI space. Asterisks indicate significant difference (*p < 0.05 and **p < 0.01).

