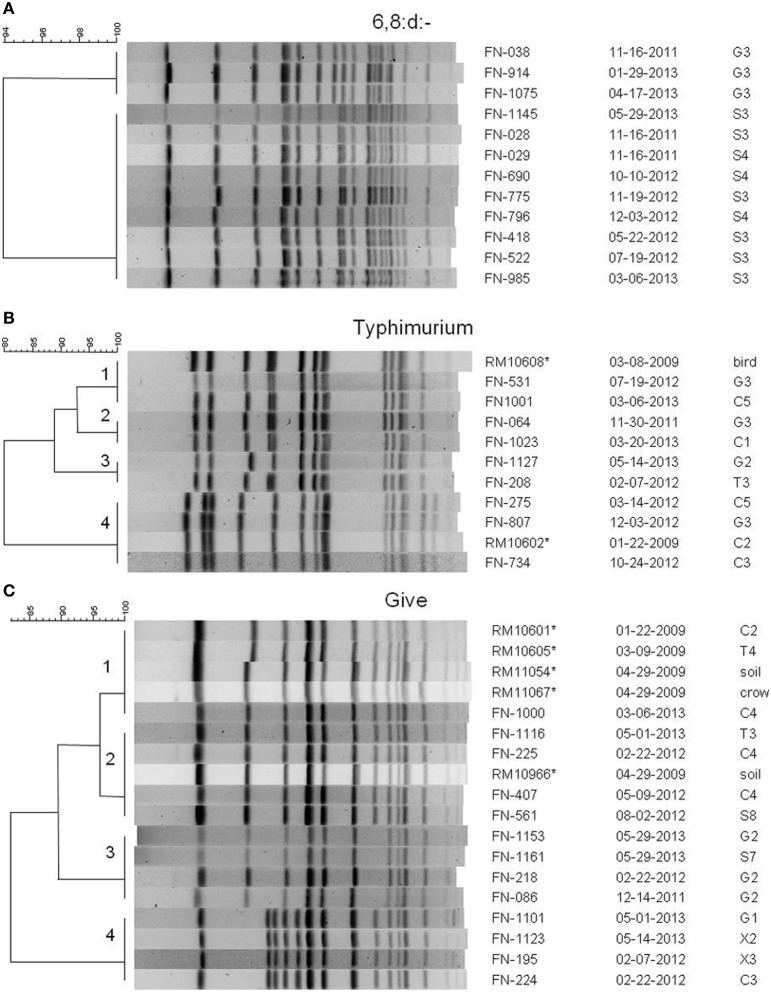
Figure 3.
PFGE patterns from XbaI digests of selected Salmonella isolates of serotypes (A) 6,8:d:-, (B) Typhimurium, and (C) Give. Dendrograms were generated in BioNumerics, and the percentage similarities of the patterns are shown on each scale. Patterns are labeled with an isolate designation number, the date of sampling (month-day-year), and the site from which it was isolated. Sampling sites and designations correspond to the maps in Figures 1, 2. All isolates are from the current study except for those marked with an asterisk, which are isolates from a previous 2009 study (Gorski et al., 2011b), and are mentioned in the text.

