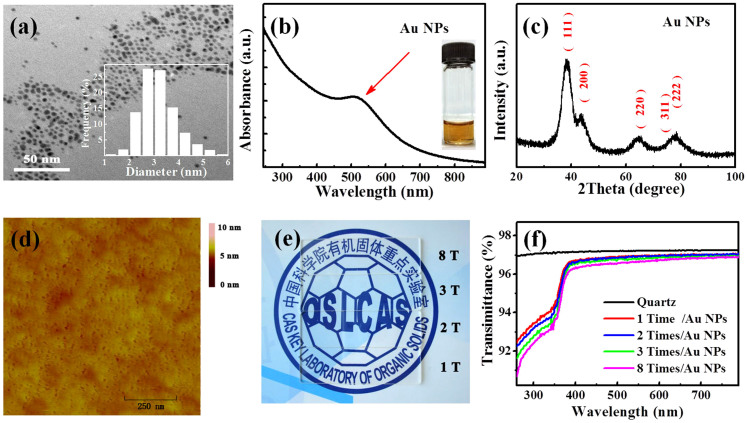
Figure 3.
(a) TEM image, (b) absorption spectrum and (c) XRD pattern of the Au NPs. (d) AFM image of the as-cast Au NPs on ZnO film. (e) Photograph of four highly transparent ZnO/Au NPs films on quartz substrate, (f) UV-Vis transmission spectra. The inset in (a) is the Au NPs size histograms and that in (b) is the Au NPs solution.

